Understanding the Impacts of Proteomics and Metabolomics on Genotype-Phenotype Relationships
This overview discusses the vast fields of proteomics and metabolomics, focusing on the size of the proteome (24,000 genes, alternative splicing, and post-translational modifications) and the metabolome (extensive small molecule sets). Various experimental techniques such as mass spectroscopy, gas chromatography, and 2D electrophoresis are introduced, highlighting their roles in mapping metabolism, disease markers, and relationships between genotypes and phenotypes. The complexity of phenotype definition, heritability, and the challenges in empirical mapping are also discussed.

Understanding the Impacts of Proteomics and Metabolomics on Genotype-Phenotype Relationships
E N D
Presentation Transcript
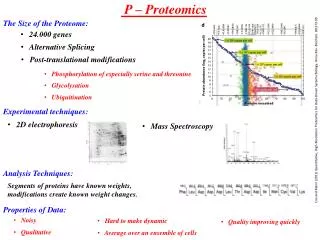
P – Proteomics The Size of the Proteome: • 24.000 genes • Alternative Splicing • Post-translational modifications • Phosphorylation of especially serine and threonine • Glycolysation • Ubiquitination Cox and Mann (2011) Quantitative, High-Resolution Proteomics for Data-Driven Systems Biology. Annu.Rev. Biochem. 80.273-99 Experimental techniques: • 2D electrophoresis • Mass Spectroscopy Analysis Techniques: Segments of proteins have known weights, modifications create known weight changes. Properties of Data: • Noisy • Hard to make dynamic • Quality improving quickly • Qualitative • Average over an ensemble of cells
M – Metabonomics The Size of the Metabolome: • Set of small molecules • Combinatorial techniques allow exhaustive listing – extremely large numbers • Databases exists (eg Beilstein) with all empirically known – millions. • Standard textbook – maximally thousands. Observed tens of thousands Experimental techniques: Objectives: • Mapping of Metabolism • Disease Markers • Gas chromatography www.metabolomics.ca/ Saito and Matsuda (2010) Metabolomics for Functional Genomics, Systems Biology and Biotechnology. Annu. Rev. Plant. Sci. 61-461-89 • Mass Spectroscopy • Nuclear Magnetic Resonance (NMR) Analysis Techniques: • Principal Component Analysis • Metabolic Network Analysis Properties of Data: • Noisy • Hard to make dynamic • Quality improving quickly • Qualitative • Average over an ensemble of cells
GF • Mechanistically predicting relationships between different data types is very difficult • Empirical mappings are important • Functions from Genome to Phenotype stands out in importance • G is the most abundant data form - heritable and precise. F is of greatest interest. Phenotype Protein Metabolite DNA mRNA “Zero”-knowledge mapping: dominance, recessive, interactions, penetrance, QTL,. Mapping with knowledge: weighting interactions according to co-occurence in pathways. Model based mapping: genomesystemphenotype Height Weight Disease status Intelligence ………. Environment
Phenomics Why care about phenotypes ?? They define an individual [including disease status] Evolution/Selection works on G via F: How to define a phenotype?? Houle et al. (2010) Phenomics: the next challenge. Nature Review Genetics. 11.12.855- Major issues: Measurement error Correlation between traits Life stage and environmental dependencies? Special Traits: Fitness Disease susceptibility Molecular Phenotypes International effort in systematic collection of phenotypes especially in model organisms
The General Problem is Enormous Set of Genotypes: 1 3* 107 • Diploid Genome • In 1 individual, 3* 107 positions could segregate. • In the complete human population 5*108 might segregate. • Thus there could be 2500.000.00 possible genotypes Partial Solution: Only consider functions dependent on few positions • Causative for the trait Classical Definitions: • Single Locus Dominance Recessive Additive Heterotic • Multiple Loci Epistasis: The effect of one locus depends on the state of another Quantitative Trait Loci (QTL). For instance sum of functions for positions plus error term.
Heritability: Inheritance in bags, not strings. The Phenotype is the sum of a series of factors, simplest independently genetic and environmental factors: F= G + E Relatives share a calculatable fraction of factors, the rest is drawn from the background population. This allows calculation of relative effect of genetics and environment Heritability is defined as the relative contribution to the variance of the genetic factors: Parents: Siblings: Visscher, Hill and Wray (2008) Heritability in the genomics era — concepts and misconceptions nATurE rEvIEWS | genetics volumE 9.255-66
Heritability Examples of heritability Co-Heritability of multiple characters: Rzhetsky et al. (2006) Probing genetic overlap among complex human phenotypes PNAS vol. 104 no. 28 11694–11699 Visscher, Hill and Wray (2008) Heritability in the genomics era — concepts and misconceptions nATurE rEvIEWS | genetics volumE 9.255-66
Genotype and Phenotype Co-variation: Gene Mapping Decay of local dependency Time Reich et al. (2001) Genetype -->Phenotype Function Dominant/Recessive Penetrance Spurious Occurrence Heterogeneity genotype phenotype Genotype Phenotype Sampling Genotypes and Phenotypes Result:The Mapping Function A set of characters. Binary decision (0,1). Quantitative Character.
Pedigree Analysis & Association Mapping D r r M D M Association Mapping: Pedigree Analysis: 2N generations Pedigree known Few meiosis (max 100s) Resolution: cMorgans (Mbases) Pedigree unknown Many meiosis (>104) Resolution: 10-5 Morgans (Kbases) Adapted from McVean and others
Protein Interaction Network based model of Interactions PHENOTYPE NETWORK GENOME 2 n 1 The path from genotype to genotype could go through a network and this knowledge can be exploited Rhzetsky et al. (2008) Network Properties of genes harboring inherited disease mutations PNAS. 105.11.4323-28 Groups of connected genes can be grouped in a supergene and disease dominance assumed: a mutation in any allele will cause the disease.
PIN based model of Interactions Emily et al, 2009 Gene 1 Gene 2 Single marker association Protein Interaction Network PIN gene pairs are allowed to interact Phenotype i 3*3 table SNP 1 Interactions creates non-independence in combinations SNP 2
Data, Integrative Genomics, Mapping and Functional Explanation Data: G, T, P, M, E & F Concepts: Networks, Integrative Genomics, Systems Biology & Correlations Mappings: Heritability, Causative Positions, QTLs, Interactions Functional Explanation: Yet to come
Cost of Disease • Most research in the bioscience is motivated by hope of disease intervention. • Major WHO projects have tried to tabulate the costs of different diseases Alan D Lopez, Colin D Mathers, Majid Ezzati, Dean T Jamison, Christopher J L Murray Global and regional burden of disease and risk factors, 2001: systematic analysis of population health data Lancet 2006; 367: 1747–57 • Genetic Diseases are diseases where there is genetic variation in the susceptibility. • Even small improvements would save many billions
Computational Biology and Bioinformatics http://www.stats.ox.ac.uk/research/genome/projects 11.10 Models of substitution I : Basic Models 12.10 Models of substitution II : Complex Models 18.10 Phylogenies I: Combinatorics 29.10 Phylogenies II: Distance, Parsimony & Likelihood 25.10 The Ancestral Recombination Graph & Pedigrees 26.10 Alignment Algorithms I Optimisation Alignment [AN] 01.11 Alignment Algorithms II Statistical Alignment 02.11 Stochastic Grammars and their Biological Applications: Hidden Markov Models 07.11 RNA structures 09.11 Challenges in Genome Annotation 14.11 Finding Signals in Sequences 16.11 Networks: Dynamics and Inference/Evolution 21.11 Grammars 23.11 Models of Evolution of Structures & Movements & Shapes & Grammars 29.11 Integrative Genomics: The Omics 30.11 Integrative Genomics: Mapping A T Metabolite Phenotype Protein DNA mRNA ACT-T -GTCT