i 1
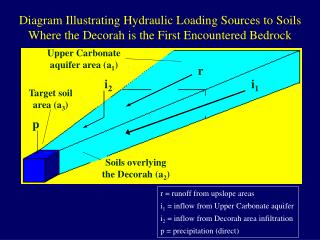
Diagram Illustrating Hydraulic Loading Sources to Soils Where the Decorah is the First Encountered Bedrock. Upper Carbonate aquifer area (a 1 ). r. i 2. i 1. Target soil area (a 3 ). p. Soils overlying the Decorah (a 2 ). r = runoff from upslope areas

i 1
E N D
Presentation Transcript
Diagram Illustrating Hydraulic Loading Sources to Soils Where the Decorah is the First Encountered Bedrock Upper Carbonate aquifer area (a1) r i2 i1 Target soil area (a3) p Soils overlying the Decorah (a2) r = runoff from upslope areas i1 = inflow from Upper Carbonate aquifer i2 = inflow from Decorah area infiltration p = precipitation (direct)
Average Hydraulic Loading Rates by Source for the Decorah-Edge Landscape Setting in the Rochester Area Upper Carbonate aquifer area contribution = r (a1) + i1 (a1) Qa = average annual hydraulic loading to target soil area Qa = r (a1+ a2)+ i1 (a1)+ i2 (a2)+ p (a3) r = 2 in/yr (1.2 gal/ft2 /yr) i1 = 7 in/yr (4.3 gal/ft2 /yr) i2 = 5 in/yr (3.1 gal/ft2 /yr) p = 29 in/yr (18 gal/ft2 /yr) Decorah area contribution = r (a2) + i2 (a2) Target soil area contribution = p (a3)
Generalized Shapes of Hydraulic Loading Areas in the Decorah Edge Landscape Setting Upper Carbonate aquifer area Decorah bedrock area Target soil area Head Slopes Nose Slopes Side Slopes
Cross Section Showing Hydraulic Loading Sources to Soils in the Decorah-Edge Hydrogeologic Setting r = runoff from upslope areas i1 - inflow from Upper Carbonate Aquifer i2 = inflow from Decorah area infiltration p = precipitation (direct) r i1 p i2
Calculated Hydraulic Loadings at the Decorah-Platteville Contact by Landscape Setting at PDS #1
Area of Upper Carbonate Plateau Drainingto Recharge Zones at PDS #1 23 acres drain to Head Slope Area 1.8 acres drain to Side Slope Area
Modeled Average Annual Hydraulic and Nitrogen Loading Rates into Soils Overlying the Decorah at PDS #1
Modeled Water Storage Volumes and Average Residence Times by Landscape Setting at PDS#1 (with runoff)* * Assumes an average of one foot of saturated soil (30% water), a constant recharge/discharge rate, uniform mixing and distribution of water and no evapo-transpiration -- actual storage volumes may be larger and residence times longer.
Estimated Recharge Rates at the Decorah Edge (gals/yr/lin.ft) • USGS Modeled Rate: 18,765 • GIS Modeled Rate for South Zumbro Watershed: 9,600 • GIS Modeled Rate by Landscape Setting at PDS#1: • Head slope: 1,289,618 • Side slope: 1,340 • Nose slope: 1,000 • Average of all slopes: 4,562
Modeled Nitrogen Loading Rates by Landscape Setting at the PDS #1 9 lbs N/ac/yr 28 lbs N/ac/yr 84 lbs N/ac/yr Assumes: 11 mg/L NO3-N in Upper Carbonate aquifer inflow, 9 lbs N/ac/yr from precipitation, & 10 lbs N/ac losses in runoff from upgradient areas.
Modeled Average Annual Hydraulic and Nitrogen Loading Rates into Soils Overlying the Decorah at PDS #1