Download

1 / 34
340 likes | 448 Vues
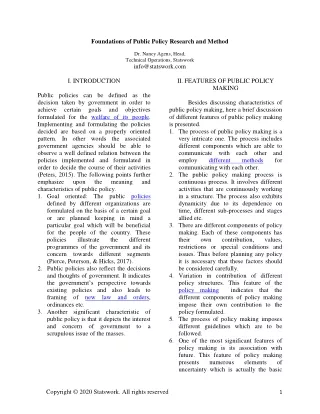
This document explores the evolving perceptions of public-private partnerships among decision-makers in light of new economic theories. It emphasizes the critical role of institutional quality in the prosperity and adaptability of societies, linking economic development to the efficiency, equity, and accountability of institutions. Key topics include the principal-agent model, information asymmetry, and the objectives of enhancing performance through organizational reforms. It addresses strategies for efficient management and pricing in public services, advocating for accountability and sustainable economic development.

E N D
Foundations of public outsourcing Marcel Boyer
Foundations of public outsourcing • Public and private decision makers’ conceptions about public-private partnerships have dramatically changed lately • New economic theories enable the analysis of organizational or institutional designs in contexts where there exist: • Complex interrelationships between various parties • Incomplete information structures (different parties having private information) • A willingness to enhance performance through organization reforms (coordination and incentives)
The prosperity of a society is based on the quality of its institutions/organizations • The prosperity of a society, its efficiency and its capacity to adapt to an ever moving environment is strongly linked: • not only to the quality of human (education) and natural resources • but also to the quality of its institutions. • The essential role of institutions and organizations is to: • organize cooperation and coordination of decisions made by large numbers of agents • motivate those economic agents to fully contribute to the mission (value maximizing, goal attainment) of the organizations/institutions • that is, to use the resources and the information at their disposal in the most efficient manner.
Regional Specific Context Performance of institutions • Efficiency • Equity • Imputability • Economic Development(regional) PRINCIPAL Techno-economic Characteristics AGENT • Constraints • Information • Transaction • Administrative and political Options Public Monopoly Public-corporate management Delegated Mgt. Concession Privatization Institutional Design
Principal-Agent Model Information Asymmetry OPPORTUNISM Divergent Interests
Social Objectives • A high performance institutional arrangement achieves in a cost efficient manner the core objectives (adapted to the specific task or project considered): • Efficiency • Equity • Imputability • Regional economicdevelopment given the transactional and informational constraints.
Objectives: Efficiency • Static and Dynamic Efficiency • Absence of spoilage, minimization of costs • Maximization of social wealth • Standards must be established, respected and verifiable • Allocating a resource to its best economic usage. • Long term Investment in: • Capacity building, innovation, R&D, quality improvement • Eco-efficiency - Global sustainable development
Objectives: Equity and Imputability • Equity - user-payer • - direct redistribution rather than indirect taxation and subsidies: accessibility but no cross-subsidization • - stand alone cost (CORE) • Imputability - the protection of the public • - open and transparent bidding • - incentives for long term decisions (intergenerational equity) • - level and extent of political delegation of instruments
Objectives: Economic development (regional) • Knowledge and capability building (core competencies) • Business opportunities and job creation • Efficient provision of business and social services (infrastructure) • Network economies, Economies of scale, Economies of scope
Delegated Management and efficient/optimal pricing • Productive efficiency requires the minimization of costs and the allocation of resources to their best economic usage. • Allocative efficiency gains can be made from cost reflective pricing (or tarification). • Productive efficiency can be separated from the pricing of public goods and services. • Prices can be regulated by an independent regulator through a wide range of regulatory instruments • Ramsey-Boiteux pricing • Price caps for costs control • Global price caps in Networks • Rate of return regulation • Yardstick competition
Types of Delegated Management vs. Characteristics Private sectorcommitment Privatization Extended • Ownership • Financing • Risks • Operation Franchise,Concessions Lease, affermage Service agreements Limited Public None Rights perpetual short term long term perpetual Delegation none limited partial extensive complete
Delegated Management and Regulation • - base pricing • Incentive regulation - cost overruns • - productivity gains • Cost plus regulation (ROR) • Price-cap regulation (RPI - X + Y) • Menu of contracts
Incentive power of pricing schemes HIGH POWERED (firms keep all gains from reduction of costs) • Fixed fee or fixed price cap • Price cap with revisions every N years on the basis of yardstrick performance • Price cap with expectation of revisions on the basis of cost • Expected (ex-ante) cost + rate of return fixed for multiple years • Expected (ex-ante) cost + rate of return revised every year • Actual (ex-post) cost + rate of return LOW POWERED (firms keep none of the gains from reduction of costs) Source: adapted from Jones (1994). Examples:
Designing contracts for public-private partnerships: • Different clauses different compensation • liability & control sharing • risk management and sharing • cost sharing • conflict resolution
Designing contracts for public-private partnerships: Liability and control / Information strict liability strict, joint and several liability extended liability capital structure limited liability incentives for care and diligence
Designing contracts for public-private partneship: Risk management (integrated) * Choosing a risk-return combination risk risk management ressource management return * Sharing risk - risk aversion / tolerance - risk pricing
Delegated Management and Cost Sharing • Multiple public - one private partnerships • Principles - fairness / equity • - coherence • - efficiency • - cross-subsidies • The Shapley-Shubik approach • (incremental costs) • The sequential cost sharing approach • (heterogenous needs and demands)
Designing contracts for public-private partnership: • Conflict resolution • Inserting the process in the contract • Exchanging information / arguments • Third party arbitrage • Residual rights owner • - value and pricing
Choosing partners in public-private partnership: • Competitive tendering (public and private) • Multiple steps auctions • Multiple criteria selection • Open bidding rules • - participation conditions • - open access to information • • Dynamic incentives and opportunism • Contract renewal procedures
Delegated Management and Performance Incentives • Principles - informativeness • - intensity of incentives • - equal compensation • - intensity of monitoring • - ratchet • Benchmarking / Scorecard • Auditing process
Role of the public partner (municipal) • Core competencies • - identifying public needs • (broker of citizens interests) • - arbitrage between needs • - managing contracts for maximal social value creation • Time horizon and incentives
The role of the private partner • Core competencies • - technology use and development • - economies of scale and scope • - development and export of know-how (human capital) • Reputation building: Dynamic incentives and opportunism
Delegated Management of Municipal Services in Canada: • The CIRANO Survey • # of municipalities surveyed • # of questionnaires returned (filled by General Manager) • 71 activities in 10 categories • For 8 major activities, • -questions on the following characteristics: independence, complexity, standardization, uncertainty specificity • -questions on the importance of core (field, municipal business) competencies • -questions on the definition and verification of performance (cost, quality) • -questions on contract renewal procedures stipulated in contracts
Delegated Management of Municipal Services in Canada: • The CIRANO Survey • For 8 major activities (suite) • -questions on contract management procedures and use of municipal assets and employees • -questions on problems encountered during the contract • -questions on investment financing • - questions on flexibility, economies of scale, pricing (tarifs) • Perceived advantages (suggested list of 13 elements) and disadvantages (suggested list of 13 elements) • Data on the municipality (size, area, assets, income and expenditures, taxes, debt, percentage of unionized employees, etc.)
Table 1: The top ten contracted out activities (% performed by outside contractors) _____________________________________________________________________________________________ Activities Percentage Number of respondents______________________________________________________________________ Construction of buildings 89.0 296Recycling 79.2 269Legal services 77.9 321Refuse collection 70.6 302Engineering and architecture 69.0 290Burial of waste 67.7 266Development of IS applications 65.1 280Street lightning 60.5 307Installation of sewers 59.3 292Caretaking 46.3 325
Table 2: The bottom 10 activities being contracted out (% performed by outside contractors) ______________________________________________________________________ Activities Percentage Number of respondents ______________________________________________________________________ Secretarial services 3.49 346 Permits and licences 5.92 333 Billing and collection 6.27 347 Accounting 6.51 347 Tax collection 7.55 323 Human resources 1.90 339 Road signs 11.07 330 Suplies 11.30 327 Fire department 13.17 330 Archives 14.28 315
Table 3: The ten activities for which outsourcing intentions are the highest (in %) _____________________________________________________________________________ Activities Percentage Number of respondents _____________________________________________________________________________ Ice rinks 10.4 269 Development of I.S. applications 9.6 281 Snow removal 8.5 331 Caretaking / security 7.6 327 Sewage treatments 7.5 266 Refuse collection 7.3 301 Road maintenance and repairs 7.2 332 Management of SI-related activities 6.5 294 Water supplies 5.9 271 Recycling 5.5 273
Table 4: The ten activities for which outsourcing intentions are the weakest (in %) _____________________________________________________________________________ Activities Percentage Number of respondents _____________________________________________________________________________ Fire department 0.6 330 Supply 0.9 331 Permits and licences 1.5 334 Secretarial services 1.7 346 Accounting 1.7 346 Strategic planning 2.2 323 Legal services 2.2 323 Human resources 2.4 339 Tax collection 2.5 323 Archives 2.5 317
Table 5: The ten top activities for which outsourcing would be most profitable (in %) _____________________________________________________________________________ Activities Percentage Number of respondents _____________________________________________________________________________ Refuse collection 21.3 301 Caretaking 18.0 328 Engineering and Architecture 18.0 295 Development is IS applications 17.2 279 Ice rinks 17.2 268 Building maintenance 17.0 342 Construction of buildings 16.2 297 Installation of sewers 15.8 292 Snow removal 15.4 331
Table 6 : Five activities for which intentions are constrained (in %) _________________________________________________________ Activities Percentage _________________________________________________________ Engineering and architecture 15 Blue box system 15 Refuse collection 14 Construction of buildings 13 Collection of hazardous waste 13
Table 7 : Profile of outsourcing contracts _______________________________________________________________________________ Probability of renewing Average length of contract the contract (in years) _______________________________________________________________________________ Refuse collection 5.5 3.9 Processing of hazardous waste 5.5 2.8 Water supply 5.8 7.8 Sewer maintenance and repairs 5.2 2.2 Snow removal 5.0 3.2 Road maintenance and repairs 4.8 2.7 IS operations 5.5 2.3 Development is IS applications 5.4 2.3
Table 8 : Management problems with outsourcing contracts (% of respondents) _________________________________________________________________________________ Reliability Quality of Controversy in Breach of Legal service interpretation contract settlement ____________________________________________________________________________________________ Refuse collection 15 20 24 5 4 Processing of hazardous waste 1 2 2 1 0 Water supplies 4 5 8 2 5 Sewer maintenance and repairs 3 6 6 0 1 Snow removal 12 21 12 4 2 Road maintenance and repairs 9 10 10 2 3 IS operations 5 7 2 0 0 Development of IS applications 6 9 2 0 0
Table 9 : Management mechanisms ____________________________________________________________________________________ Contract Refuse Processing of Water Sewer Snow Highway IS operations Computer management collection hazardous supplies maint. & clearance maint. & application measure waste repairs repairs development ____________________________________________________________________________________ Meetings between 49 22 28 12 21 14 29 31 senior management and outsourcer Meetings between 41 25 23 24 41 27 29 28 middle management and outsourcer Meetings between 18 6 15 9 25 18 18 17 municipal employees and outsourcer Regular employee 30 8 10 9 17 9 10 13 exchanges Use of municipal 3 4 3 3 2 1 6 7 equipment by contractor Transfers of employees 1 0 4 2 0 1 1 1 Arbitration mechanisms 27 10 13 7 8 7 3 4 for disagreements
Table 10 : Main advantages and disadvantages of outsourcing ___________________________________________________________________________________ Advantages Disadvantages ___________________________________________________________________________________ 1. Savings 1. Difficult to select best supplier 2. Access to specific expertise 2. Loss of control over the activity contracted out 3. Alleviation of constraints arising from 3. Negative impact on labour relations collective agreements 4. Improved ability to adapt to change 4. Irreversibility of the decision to contract out 5. Reduction of payroll 5. Difficult to monitor the contract