Download
1 / 40
410 likes | 1.69k Vues
6.1 Rates of reaction. 6.1.1 Define the term rate of reaction . 6.1.2 Describe suitable experimental procedures for measuring rates of reactions 6.1.3 Analyze data from rate experiments. Chemical Kinetics.

E N D
6.1 Rates of reaction 6.1.1 Define the term rate of reaction. 6.1.2 Describe suitable experimental procedures for measuring rates of reactions 6.1.3 Analyze data from rate experiments
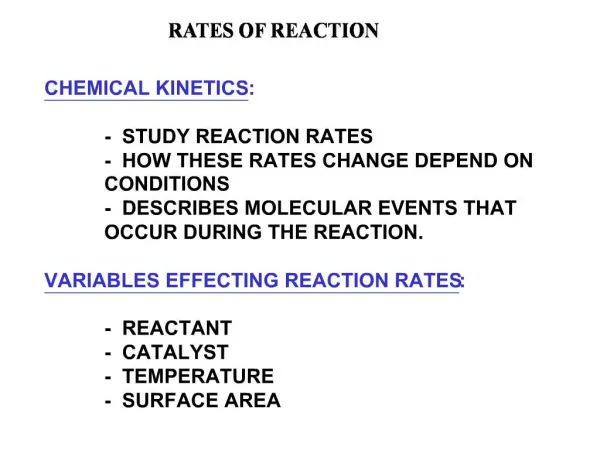
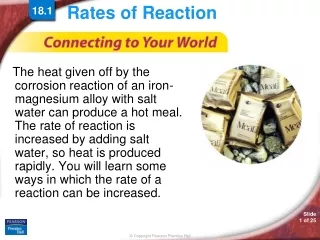
Chemical Kinetics • The study of rates of chemical reactions and the mechanisms (or steps) by which a chemical reaction takes place. • Reaction rates vary greatly – some are very fast (burning) and some are very slow (disintegration of a plastic bottle in sunlight).
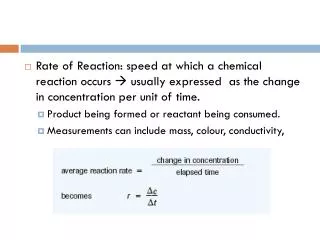
Rate of Reaction • The rate of a reaction is the change in concentration of a product per unit of time (rate of formation of product). • Also viewed as the negative of the change in concentration of a reactant per unit of time (- rate of disappearance of reactant). • Rxn Rate (avg) = Δ[reactant or product] Δ time • [square brackets] = mol/L
Measuring Reaction Rates Decomposition of H2O2 Time, s Accumulated mass O2, g [H2O2], M 0 0 0.882 60 2.960 0.697 120 5.056 0.566 180 6.784 0.458 240 8.160 0.372 300 9.344 0.298 360 10.336 0.236 420 11.104 0.188 480 11.680 0.152 540 12.192 0.120 600 12.608 0.094
Some Kinetic Data Kinetic data for the reaction: H2O2(aq) H2O(l) + ½ O2(g) Rates are obtained from the slopes of the straight lines: • an average rate from the purple dotted line • the instantaneous rate at t = 300 s from the red line • the initial rate from the blue line.
Understanding the graph • Concentration of reactant decreases with time, as it is being used up • The rate is fastest when concentration of reactants is greatest; and slows when concentration of reactants are less. • Decreasing numbers of reactants means less collisions producing new product.
Measuring rate of reactions • Any property that changes between the start and end of the reaction can in principle be used. • The larger the changes the better the accuracy of its measurement. • Any ideas of what we could measure?
Light absorption • If a reaction produces a precipitate (an insoluble compound) we can time how long it takes the formation of product to cloud the view of a mark made on a piece of paper placed under the reaction vessel. • A spectrophotometer (measures wavelength of the color forming in solution)or a colorimeter (filters out a specific color) could also be used
Collecting an evolved gas • The gas produced is collected in a syringe or in a graduated vessel over water (gas can’t be water soluble) • The volume can be collected a different times and recorded
Other techniques • Electrical conductivity • Presence of ions allows a solution to conduct. The reaction rate may be found from the changes in conductivity. • Titration • Taking small samples throughout experiment and testing for amounts of product made at that time. • pH (not great method) because dealing with small changes in concentration over the pH scale.
6.1.2 Describe suitable experimental procedures for measuring rates of reactions How fast does a reaction happen? How would we measure that? • We need an indicator that a reaction is happening • Color change • Gas evolution • Precipitate formation • Heat and light • In many cases its easiest to measure how fast the product is appearing • Example: MgCO3(s) → MgO(s) +CO2 (g) • The easiest thing to measure here would probably be the CO2 • We could collect the CO2 in a syringe and measure how the volume changed with time. The rate would be: • ∆ Volume/time • We could also measure how the reactant is disappearing
6.1.2 Describe suitable experimental procedures for measuring rates of reactions Measuring the Rate of Reaction There are many ways to measure rate: ∆ Mass / time ∆ Volume / time ∆ Concentration / time ∆ Pressure / time ∆ pH / time ∆ Color / time (Use of a spectrophotometer or colorimeter) ∆ Conductivity / time 12
6.2 Collision theory 6.2.1 Describe the kinetic theory in terms of the movement of particles whose average energy is proportional to temperature in Kelvin's. 6.2.2 Define the term activation energy, Ea 6.2.3 Describe the collision theory 6.2.4 Predict and explain, using the collision theory, the qualitative effects of particle size, temperature, concentration and pressure on the rate of a reaction. 6.2.6 Describe the effect of a catalyst on a chemical reaction
Kinetic Molecular Theory • Model of what happens to gas particles during experimentation • Large numbers of molecules in continuous motion • Attractive and repulsive forces are negligible • Energy is transferred between molecules during collisions, but average kinetic energy is unchanged (as long as temp is constant) • Kinetic energy of molecules is proportional to the absolute temperature. (in K)
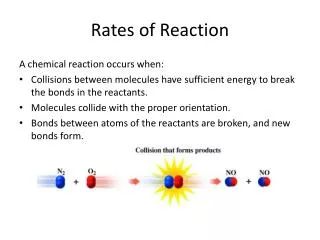
The Collision Theory • is an explanation of what is necessary for a chemical reaction to occur. • This theory states when a chemical reaction takes place, the reactant particles must… • collide with a certain minimum amount of energy, called activation energy. • This energy is required to break chemical bonds in the reactants. • The energy of each particle is not important, it is the energy of the collision.
A Reaction Profile CO(g) + NO2(g) CO2(g) + NO(g)
Particles must collide with the proper geometry or orientation for atoms to come in direct contact and form the chemical bonds of the products. (steric factor)
If both of these conditions are not met, particles will merely collide and bounce off one another without forming products.
http://www.mhhe.com/physsci/chemistry/essentialchemistry/flash/collis11.swfhttp://www.mhhe.com/physsci/chemistry/essentialchemistry/flash/collis11.swf • Although, the percentage of successful collisions is extremely small, chemical reactions still take place at a reasonable rate because there are so many collisions per second between reactant particles.
Factors that effect the rate of collision, effect the rate of reaction • Concentration (and pressure with gases) • Temperature • Amount of surface area • Catalysts
Concentration • A higher concentration of reactants leads to more effective collisions per unit time, which leads to an increasing reaction rate • We are not increasing the amount being made for a given balanced equation with limiting reactants, we are only speeding up how quickly those products are made.
Pressure • affects the rate of reaction, especially when you look at gases. • When you increase the pressure, the molecules have less space in which they can move. That greater concentration of molecules increases the number of collisions. • When you decrease the pressure, molecules don't hit each other as often. The lower pressure decreases the rate of reaction
Temperature • Temperature is a measure of the kinetic energy of a system, so higher temperature implies higher average kinetic energy of molecules and more collisions per unit time.
Surface Area • Reducing the size of particles increases the rate of a reaction because it increases the surface area available for collisions to take place. This increases the number of collisions.
Catalysts • A catalyst is a substance that speeds up a reaction without being used up itself. • Some reactions have catalysts that can speed them up, but for many reactions there is no catalyst that works. • How do they work?
1. A catalyst provides a surface on which the reaction can take place. • One or more reactants are adsorbed to the surface (stick to it) • Let’s look at the example of ethene undergoing hydrogenation (breaking double bond and making single bonds while adding hydrogen) • Usually VERY slow
Interaction between the catalyst and the reactant (maybe weakening bonds, or an actual reaction with the surface) • The reactants may collide on the catalyst or one is prepared and then collide together
The product is desorbed, breaks away from the catalyst once formed • Nickel and platinum are excellent heterogeneous catalysts. They don’t adsorbed too much or too little. • Hydrogenation of vegetable oil to make margarine uses a nickel catalyst
2) A catalyst lowers the activation energy by… • providing an alternative mechanism (step in the reaction) • Reactants require less energy to react. • Sometimes catalysts seem to be used up, but they will regenerate at the end of the reaction
Maxwell-Boltzmann Curves 6.2.5 Sketch and explain qualitatively the Maxwell-Boltzmann energy distribution curve for a fixed amount of gas at different temperatures and its consequences for changes in reaction rate. 6.2.7 Sketch and explain Maxwell-Boltzmann curves for reactions with and without catalysts
In a sample gas or liquid, the molecules are in constant motion and collision. • When they do this, no energy is lost from the system - they’re elastic collisions. • Each molecule varies in its own energy, some have more, some less.
A Maxwell-Boltzmann distribution curve/graph shows how the energy was spread out over different molecules
Remember… • the area under the curve = the total molecules in the sample, and it doesn’t change • All molecules have energy • Few molecules have high energies, but there is no maximum energy for a molecule.
If you increase the temperature of the sample, the distribution becomes stretched out and has a lower peak, but the area under the curve remains the same.
In a sample • The distribution curve shows that not all particles have the same amount of energy, yet they could be made up of the same type of molecule. • Collisions cause a shift of energy from one particle to another. Some particles could be nearly still, while others have been pushed around more aggressively. The important note is that the energy is elastic between particles (transferred, but not destroyed) • All particles have an average kinetic speed, small portion are slower and a faster, but most are moving near the average speed.
To speed up the reaction, you need to increase the number of the very energetic particles - those with energies equal to or greater than the activation energy. Increasing the temperature has exactly that effect - it changes the shape of the graph. / Energy
Remember that catalysts provide an alternativeroute lowering activation energy needed, they don’t magically lower the energy needed.