Expressional and Functional Divergences between Duplicate Genes
820 likes | 943 Vues
This study delves into the mechanisms of gene duplication—an essential source of genetic innovation. With genomic and proteomic data, we analyze the evolutionary trajectories, focusing on expression and functional divergences. We discuss how the vast majority of duplicate genes become pseudogenes, while a subset diverges functionally, often initiating with expression changes. By employing microarray technologies and regression analyses, we reveal significant correlations between expression divergence and evolutionary time, enhancing our understanding of duplicate genes' evolutionary fates across various species.

Expressional and Functional Divergences between Duplicate Genes
E N D
Presentation Transcript
Expressional and Functional Divergences between Duplicate Genes Wen-Hsiung Li University of Chicago
Why study duplicate genes? • Gene duplication is the primary source of genetic novelties (Ohno 1970). • Genomic (including functional and proteomic) data provide excellent materials for studying the mode, tempo, and mechanisms of the evolution of duplicate genes.
X chromosome Autosome Humans Apes Old World Monkeys ? New World Monkeys Origin of trichromacy: Traditional View
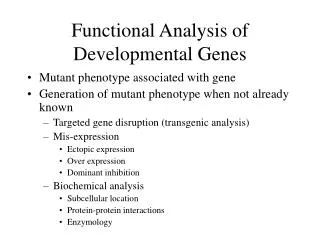
Evolutionary Fates of Duplicate Genes (1) In the vast majority of cases the extra copy resulted from a gene duplication will become nonfunctional (a pseudogene) because deleterious mutation occurs much more often than advantageous mutation.
Evolutionary Fates of Duplicate Genes (2) One way for both copies to be retained in the genome is to diverge in function. The first step for divergence in function is commonly believed to be divergence in expression.
Divergence in Expression between Duplicate Genes at the Genomic Level Trends in Genetics, 2002 Zhenglong Gu, Dan Nicolae, Henry Lu and Wen-Hsiung Li
Markert, Clement L. (1964) Isozymes: Enzymes from duplicate genes Differences in expression among tissues. Protein electrophoresis.
S. Ohno (1970) proposed Expression divergence: A major mechanism for retaining duplicate genes in a genome. The first step in functional divergence. Buthow often and how fastdoduplicate genes diverge in expression?
Past studies: Limited number of gene families, providingno general pictureof the tempo of expression divergence between duplicate genes in a genome. Microarray gene expression technology and complete genome sequencing: a general picture The Yeast Genome
Similarity between expression patterns of two genes R = the correlation coefficient of the expression levels of the two genes over different time points of an experiment (a physiological process)
Wagner (2000) PNAS Protein sequence divergence and expression divergence:decoupled It does not imply that expression divergence and evolutionary time are decoupled because protein distance may not be a good proxy of divergence time.
Although a protein may evolve at an approximately constant rate over time, the rate of amino acid substitution varies tremendously among proteins, so that a single distance cannot be applied to date the divergence times of different protein (or gene) pairs.
In comparison, the rate of synonymous substitution is more uniform among genesand so synonymous distance (KS) would be a better proxy of divergence time. We therefore rely more on KS than on protein distance or KA (non-synonymous distance).
Detection of Duplicate Genes: Gu et al. , MBE 2001 Two proteins belong to the same family: (1) if their similarity (including gaps) is > 30%, and (2) if the total length of the alignable regions is > 80% of the longer protein.
Selection of Duplicate Genes (1) To avoid using correlated data points, we select independent pairs of duplicate genes in the yeast genome. For each gene family our selection proceeds with increasing KS, because gene pairs with a small KS are fewer than those with a large KS and can more accurately reflect the time course of expression divergence.
Selection of Duplicate Genes (2) We require that both duplicate genes do not show strong codon usage bias, which can retard the increase of KS so as to make KS a poor proxy of divergence time.
Linear regression analysis Since R is bounded by –1 and 1, the transformation ℓn((1+R)/(1-R)) was used. The normal linear regression was then carried out between KS (KA) and the transformed R .
R = 0.02, P = 0.78 R = -0.52, P = 5.45e-12
R = -0.42, P =3.17e-6 R = -0.07, P =0.37
Conclusion A significant negative correlation (-47%, P < 2 ×10⁻⁵) between R and KS. So, expression divergence increases with KS and evolutionary time. Expression divergence and KA are initially coupled to some extent.
In the above analysis all experiments were considered together, that is, the correlation coefficient R was calculated over all data points. This pooling of data may obscure the relationship between expression divergence and sequence divergence because a pair of duplicate genes may be involved in only some but not all of the physiological processes tested.
Note that if a gene pair is not involved in a process, it is unlikely to evolve expression divergence in that process. We now consider R separately for each of the 14 independent tests that we can obtain from current data.
Definition of divergent expression: Two duplicate genes are said to have diverged in expression if n or more negative R’s in the 14 processes used are observed. We considered n = 1 and 2.
A sliding window analysis was used when the 14 processes used were treated separately. For the gene pairs within the KS (±0.25) or KA (±0.05) window of each studied duplicate gene pair, the proportion of gene pairs with divergent expression is calculated.
1 0.8 0.6 ≥ 1 negative R ≥ 1 negative R % (Divergent Pairs) ≥ 2 negative R ≥ 2 negative R 0.4 0.2 0 0 0.25 0.5 0.75 1 1.25 1.5 K S a b Figure 2
Figure 2a: Over 60% of the pairs studied show “divergent expression” even when KS is ≤ 0.10. The proportion of divergent expression increases with KS and becomes almost 1 when KS increases to ~1. Even if we define “divergent expression” as having ≥ 2 R’s in the 14 tests, still over 50% of the duplicate pairs meet this definition when KS is ≤ 0.10.
Clearly, expression divergence has occurred rather quickly in many of the gene pairs studied. This is also seen in Fig. 2b, where the proportion of pairs with diverged expression increases rapidly with KA and reaches a plateau when KA is ~0.15.
“Expression divergence” Two duplicate genes have diverged in expression, if the correlation coefficient (ρ) of their expression levels over time points is 0.5 or smaller.
Test procedure: We consider 9 processes. For each process we compute the correlation coefficient (R) of the expression levels over time points. Consider the two smallest R’s. We require that the probability of observing the two smallest R’s among the 9 processes is < 0.05.
For each of the 9 processes with 8 or more data points available, the correlation coefficient of gene expression between duplicate genes was calculated.
Non-parametric bootstrapping: Good for a single process (experiment) But difficult for more than one process. Parametric bootstrapping:
For each process, bootstrap a sample with n pseudo-data points Z* = {z*i: i=1, …, n} from a bivariate normal distribution with means and covariance matrix: Compute R*, the correlation coefficient from the bootstrap sample Z*
Repeating the pseudosampling procedure B times, we observe R*1, …, R*B. The empirical distribution of R*1, …, R*Bis used to approximate the distribution of R. In particular, I{}: an indicator function whose value is 1 when the event is true and 0 otherwise.
Suppose that m processes are studied and there are nj pairs of observations for process j, j = 1, …, m. From the above approximation, we can evaluate the probability of
Then, we can find out the probability that the two smallest R’s are smaller than c1 and c2, respectively, with c2 < c1
Conclusions: 1. Expression divergence between duplicate genes is significantly correlated with their synonymous divergence (KS); 2. Expression divergence and KA are initially coupled;
3. A large proportion of duplicate genes have diverged quickly in expression and the vast majority of gene pairs eventually become divergent in expression.
Divergence in the Spatial Pattern of Gene Expression between Human Duplicate Genes Genome Research, 2003 Kateryna Makova and Wen-Hsiung Li
Expression Data The expression data for 25 human tissues were retrieved from Su et al. (2002, PNAS). Expression values were averaged among replicates.
Advantages of human data over yeast data 1.Affymetrix oligonucleotide array data instead of cDNA array data: a lower chance of cross-hybridization 2. Multiple tissues: spatial expression divergence vs. temporal divergence 3. Better definition of divergence 4. A larger data set (1230 pairs of duplicate genes vs. 400 pairs)
Definition of Expression of a gene in a tissue • Expressedin a tissue: If the average difference (AD) is > 200; this corresponds to ~3 to 5 copies of mRNA per cell. • Not expressed:If AD < 100. • Marginally expressed: If 100 < AD < 200.
Definition of Expression Divergence in a tissue Two duplicate genes are said to have diverged in gene expression in a tissue, if one is expressed in the tissue while the other is not.