Navigating the Path to Effective Multi-Core Tools for Parallel Software Development
150 likes | 264 Vues
This presentation explores the current landscape and future directions of multi-core programming tools, focusing on the motivational factors, challenges, and necessary improvements within the field. It highlights the persisting issues with parallel software development, including threads and locks, while presenting existing tools like Intel® Thread Checker and Profiler. The discussion emphasizes the need for enhanced capabilities, improved defect detection, and better performance projections to ensure efficient multi-core applications. Ultimately, it aims to identify solutions for better analysis and execution in the evolving world of concurrency.

Navigating the Path to Effective Multi-Core Tools for Parallel Software Development
E N D
Presentation Transcript
The Path to Multi-core Tools Paul Petersen
Outline • Motivation • Where are we now • What is easy to do next • What is missing
Motivation • Look at the way parallel software is written • Threads & Locks • This has not really changed for decades • The names and details change • Ultimately the languages leave it up to the user to get right • This means the user will sometimes get it wrong
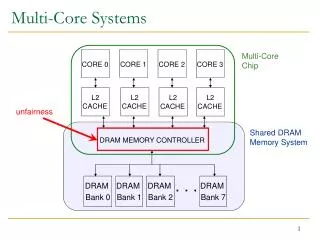
Breakpoint Debuggers State inspection tools MS Visual Studio Totalview, Gdb, Idb Profilers VTune™ Performance Analyzer Structural Function or Loop Statistical HW or SW based Runtime Analysis Intel® Thread Checker Intel® Thread Profiler Libraries OpenMP Threading Building Blocks Higher-level abstractionfor multi-core codes Understandable by analysis tools Where Are We Now
Intel® Thread Checker • Observes the interaction in a concurrent application through memory references and synchronization operations • Compiler or binary instrumentation • Execution driven simulation • Detect incorrect threading api usage and asynchronous memory references
Intel® Thread Profiler • Observes the interactions in a concurrent application through the synchronization operations • Compiler or binary instrumentation • Event trace generation and analysis • Detects bottlenecks through critical path analysis • In a concurrent application not all computation is equally important
Tooltips provide object information Thread Profiler – Summary View Let’s filter and group this by object
What Is Easy To Do Next • Enhance our current tools • Additional serial analysis • Detect opportunities for parallel execution • Improve efficiency • Focus capabilities • Expand platform coverage • Example - managed languages like C# or Java • Mining the data we have now • Suggest which problems should be tackled first
What Is Missing • Performance Projections • What-If analysis is very hard to do accurately • You need a very details system model, and very accurate understanding of what will change by running on a different system • Changing the number of threads, can cause non-linear scaling problems by exposing a bottleneck that did not appear to be significant as smaller thread counts
What Else Is Missing • Defect Detection • Moving from asynchronous memory access detection • To non-atomic object access detection. • Users typically assume that modifications to “objects” are atomic • But they have a hard time describing what is the “object” at any point in time.
And Everything Else… • A tool is, among other things, a device that provides a mechanical or mental advantage in accomplishing a task • This talk has focused on a collection of analysis tools specifically designed to aid in understanding threaded applications
Conclusion • Multi-core software poses many challenges that sequential software does not face • We have the first round of tools specifically designed for the problems faced by the way parallel software is written • These tools are limited to mostly just observing what happened, and reporting interesting facts about the program. • They have a hard time generalizing these observations
The The The The Path Path Path Path To To To To Multi-core Multi-core Multi-core Multi-core Tools Tools Tools Tools