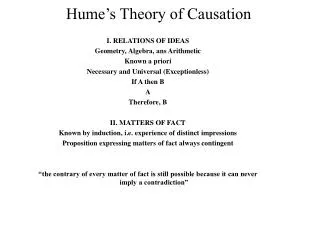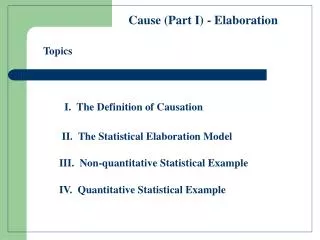
I. The Definition of Causation
Causation. Topics. I. The Definition of Causation. II. The Statistical Elaboration Model. III. Non-quantitative Statistical Example. IV. Quantitative Statistical Example. Causation. I. The Definition of Causation. - Four Characteristics. A. Co-variation. B. Over a valid time frame.

I. The Definition of Causation
E N D
Presentation Transcript
Causation Topics I. The Definition of Causation II. The Statistical Elaboration Model III. Non-quantitative Statistical Example IV. Quantitative Statistical Example
Causation I. The Definition of Causation - Four Characteristics A. Co-variation B. Over a valid time frame C. Of a non-spuriousnature D. That is grounded in theory
Causation II. The Statistical Elaboration Model A. Elimination B. Specification Spuriousness X e.g. the effectof fire size (Z) on the relationship between # of firemen (X) and damage (Y) 1. Antecedent Z Y 2. Intervening X Y e.g. the effectof education (Z) on the relationship between age (X) and income (Y) Z
Causation III. Non-quantitative Statistical Example Step 1 – Construct the zero order cross-tabulation table. The Marginal (Zero-Order) Table Step 2 – Calculate the zero order measure of association. e.g. Lambda = 40/40 – 30/40 = .25 or Phi = (25-20)2/20 + (15-20)2/20 + (15-20)2/20 + (25-20)2/20 = square root of 5/80 = .25
Causation Step 3 – Construct the first order partial tables. The Marginal Table Partial Table for Young Partial Table for Old = + Total Young Old Lambda .25 .00 1.00 Step 4 – Calculate the partial measures of association. Step 5 – Form the conclusion Since the partials have changed from the marginal measure, one getting stronger and the other disappearing, we would say that we have specified the zero order relationship as probably intervening (i.e. we are born into a sex, grow older and as a result, join a political party).
.55 – (.6) (.4) Causation IV. Quantitative Statistical Example Step 1 – Construct the zero order Pearson’s correlations (r). Assume rxy= .55 where x = suicide rates and y = divorce rates. Assume further that rxz = .60 and ryz= .40, where z = unemployment rates. Step 2 – Calculate the partial correlation (rxy.z) = = .42 (rxy)2 = .30 Therefore, Z accounts for (.30-.18) or 12% of Y and (.12/.30) or 40% of the relationship between X&Y Step 3 – Draw conclusions (rxy.z)2 = .18