
Uploaded by
phoebe
1 SLIDES
148 VUES
10LIKES
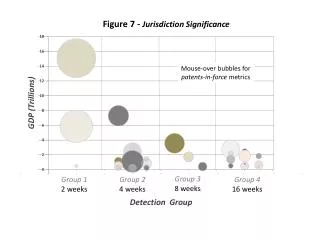
Jurisdiction Significance of Patents in Force and Economic Impact Across Groups
DESCRIPTION
This graphic illustrates the significance of jurisdiction concerning patents in force, showcasing various metrics based on GDP (in trillions) and highlighting four distinct detection groups. Each group represents a different analysis period: Group 1 (2 weeks), Group 2 (4 weeks), Group 3 (8 weeks), and Group 4 (16 weeks). Hover over the bubbles to explore how the number of patents impacts economic indicators across these jurisdictions, providing a visual representation of innovation's role in economic performance and growth.
Download
1 / 1
Télécharger la présentation 
Jurisdiction Significance of Patents in Force and Economic Impact Across Groups
An Image/Link below is provided (as is) to download presentation
Download Policy: Content on the Website is provided to you AS IS for your information and personal use and may not be sold / licensed / shared on other websites without getting consent from its author.
Content is provided to you AS IS for your information and personal use only.
Download presentation by click this link.
While downloading, if for some reason you are not able to download a presentation, the publisher may have deleted the file from their server.
During download, if you can't get a presentation, the file might be deleted by the publisher.
E N D
Presentation Transcript
Figure 7 - Jurisdiction Significance Mouse-over bubbles for patents-in-force metrics GDP (Trillions) Group 3 8 weeks Group 1 2 weeks Group 2 4 weeks Group 4 16 weeks Detection Group


More Related