Download
1 / 15
150 likes | 259 Vues
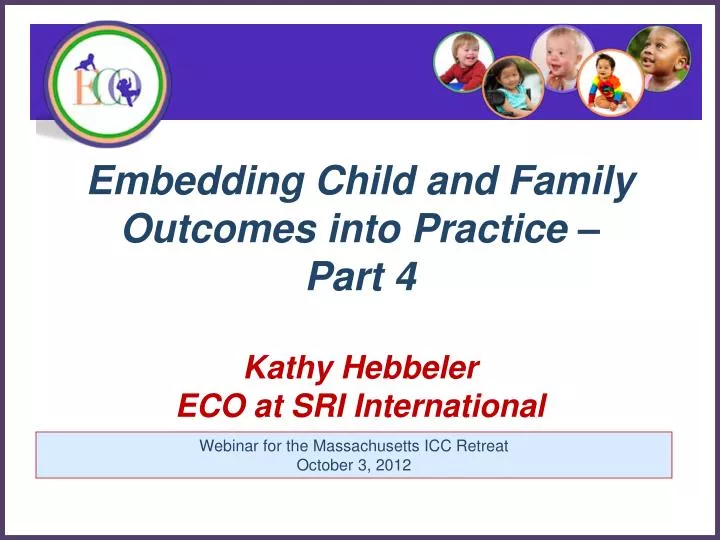
Embedding Child and Family Outcomes into Practice – Part 4 Kathy Hebbeler ECO at SRI International. Webinar for the Massachusetts ICC Retreat October 3, 2012. The National Data on Child Outcomes for EI and ECSE for 2010-11. OSEP Reporting Categories. Percentage of children who:

E N D
Embedding Child and Family Outcomes into Practice –Part 4Kathy HebbelerECO at SRI International Webinar for the Massachusetts ICC Retreat October 3, 2012 Early Childhood Outcomes Center
The National Data on Child Outcomes for EI and ECSE for 2010-11
OSEP Reporting Categories Percentage of children who: a. Did not improve functioning b. Improved functioning, but not sufficient to move nearer to functioning comparable to same-aged peers c. Improved functioning to a level nearer to same-aged peers but did not reach it d. Improved functioning to reach a level comparable to same-aged peers e. Maintained functioning at a level comparable to same-aged peers 3 outcomes x 5 “measures” = 15 numbers Early Childhood Outcomes Center
The Summary Statements • Of those children who entered the program below age expectations in each outcome, the percent who substantially increased their rate of growth by the time they turned 3 [6] years of age or exited the program. • The percent of children who were functioning within age expectations in each outcome by the time they turned 3 [6] years of age or exited the program. Early Childhood Outcomes Center
State Approaches to Outcomes Data, 2009-10 *Child Outcomes Summary Rating
Child Outcomes: What we know • States are in various stages with regard to building their child outcomes measurement systems • Some phrased in • Some changed approaches Early Childhood Outcomes Center