Download
1 / 21
210 likes | 319 Vues
Using the Absorbing Aerosol Index (AAI) to monitor GOME-2 instrument degradation. L.G. Tilstra, O.N.E. Tuinder, P. Stammes Royal Netherlands Meteorological Institute (KNMI). Expert Meeting on GOME-2 instrument degradation, KNMI, De Bilt, 04-03-2010. Outline Short introduction of the AAI

E N D
Using the Absorbing Aerosol Index (AAI) to monitor GOME-2 instrument degradation L.G. Tilstra, O.N.E. Tuinder, P. Stammes Royal Netherlands Meteorological Institute (KNMI) Expert Meeting on GOME-2 instrument degradation, KNMI, De Bilt, 04-03-2010
Outline • Short introduction of the AAI • GOME-1 instrument degradation • GOME-2 instrument degradation • SCIAMACHY instrument degradation • Overview of results / Conclusions Expert Meeting on GOME-2 instrument degradation, KNMI, De Bilt, 04-03-2010
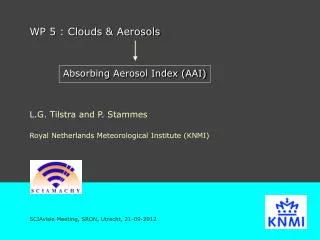
1 / Introduction: Absorbing Aerosol Index (AAI) and the residue – The AAI represents the scene colour in the UV – • Definition of the residue: where the surface albedo A for the simulations is such that: (A is assumed to be wavelength independent: A340 = A380) no clouds, no aerosols : r = 0 clouds, no absorbing aerosols : r < 0 absorbing aerosols : r > 0 B. Definition of the AAI: AAI = residue > 0 (and the AAI is not defined where residue < 0) Expert Meeting on GOME-2 instrument degradation, KNMI, De Bilt, 04-03-2010
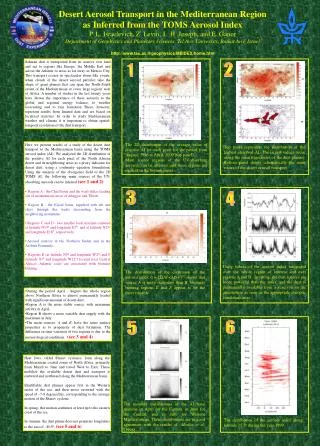
2 / Instrument degradation: GOME-1 The global mean residue (GMR), the mean of all residues on a day between 60°N and 60°S, is about constant, showing only a very mild seasonal variation. dashed green line: 12-MAR-1996, end of the GOME-1 commissioning phase 22 June 2003: loss of global coverage The seasonal cycle is caused primarily by variation in aerosol presence First signs of the effects of instrument degradation after ~4 years after launch. Expert Meeting on GOME-2 instrument degradation, KNMI, De Bilt, 04-03-2010
GMR for each individual GOME-1 scan-mirror position (East, Nadir, West): dashed green line: 12-MAR-1996, end of the GOME-1 commissioning phase GOME-1 commissioning phase: reduced footprint size, symmetry around exact nadir broken Krijger et al., ESA SP-636, 2007: Clearly, GOME-1 is showing a scan-angle dependent instrument degradation. Scan-angle dependency is modest in the first 4 years, but starts up almost immediately after launch. Expert Meeting on GOME-2 instrument degradation, KNMI, De Bilt, 04-03-2010
GMR per scan-mirror position relative to mean over scan-mirror positions: “Delta[east/nadir/west]” = GMR[east/nadir/west] – GMR[all] • Scan-angle dependent degradation starts immediately after launch • Maximum east/west bias: ~5.5 index points reached after ~6 years • East/west bias changed with ~0.8 index points over the first 3 years • Periodic behaviour: geometry effect due to changing solar position Scan-angle dependent degradation + small seasonal cycle due to geometry. Expert Meeting on GOME-2 instrument degradation, KNMI, De Bilt, 04-03-2010
3 / Instrument degradation: GOME-2 GOME-1 experience: the global mean of all residues on a day between 60°N and 60°S is about constant, showing only a very mild seasonal variation. black : GOME-2 green : GOME-2 (GOME-1 swath) red : GOME-1 (parameterisation) Similar seasonal cycle as GOME-1. First signs of the effects of instrument degradation. Expert Meeting on GOME-2 instrument degradation, KNMI, De Bilt, 04-03-2010
Global mean residue per scanner mirror position versus time (1): [ forward scan pixels only ] • Global coverage is now a factor 24 lower, yet there are enough data points for a reliable daily “global mean residue” Downward trend is for sure caused by instrument degradation; easternmost scan mirror positions are apparently affected in a different manner than the rest. Expert Meeting on GOME-2 instrument degradation, KNMI, De Bilt, 04-03-2010
Global mean residue per scanner mirror position versus time (2): [ indicated scan pixels only ] • Global mean residue at the swath edges is higher than in the middle of the swath • Global mean residue of eastern side of the swath shows a very deviating & varying behaviour • Growing east/west bias: ~1.4 index points after ~3 years For GOME-1 the viewing angles at the swath edges are much smaller. As a result, the global mean residue at the swath edges roughly equals that of the middle of the swath. Expert Meeting on GOME-2 instrument degradation, KNMI, De Bilt, 04-03-2010
Global mean residue per scanner mirror position versus time (3): [ GOME-1 swath ] • Growing east/west bias in this case: ~1.0 index points over a period of ~3 years • GOME-1: east/west bias grew with ~0.8 index points over the first 3 years after launch So, for the GOME-1 part of the GOME-2 swath the scan-angle dependent component of the degradation is only a bit higher than that of GOME-1 in the first 3 years after launch. Expert Meeting on GOME-2 instrument degradation, KNMI, De Bilt, 04-03-2010
GMR per scan-mirror position relative to mean over scan-mirror positions: “Delta_Mean[IndexInScan]” = GMR[IndexInScan] – GMR[all] [ indicated scan pixels only ] • Western and nadir scan-mirror positions degrade in more or less the same manner and rate • Eastern mirror positions degrade very differently Expert Meeting on GOME-2 instrument degradation, KNMI, De Bilt, 04-03-2010
4 / Instrument degradation: SCIAMACHY Different behaviour: • Increase in global mean residue instead of an initial decrease (as was the case for GOME-1) • Clearly also scan-angle dependent degradation after a couple of years • Roughly 5 index points higher after 8 years in space • No “maximum” reached yet (GOME-1: after ~6 years) First signs of the effects of instrument degradation after ~1 year after launch. Expert Meeting on GOME-2 instrument degradation, KNMI, De Bilt, 04-03-2010
GMR per scan-mirror position relative to mean over scan-mirror positions: • East/west bias of nearly 3 index points after ~8 years • Slower rate of instrument degradation than GOME-1/2 • Relatively late startup of scan-angle dependency compared to GOME-1 and GOME-2 SCIAMACHY instrument degradation seems to be progressing at a slower pace. Expert Meeting on GOME-2 instrument degradation, KNMI, De Bilt, 04-03-2010
5 / Overview of results / Conclusions GOME-1: scan-angle dependent degradation Slow degradation started directly after launch. Extreme degradation after ~4 years; East/west bias ~5.5 index points after ~6 years. Average degradation after 3 years : ~–0.0 pts East/west bias after 3 years : ~0.8 pts SCIAMACHY: scan-angle dependent degradation Degradation started 1 year after launch (an increase instead of a decrease). No max. yet, east/west bias ~3 index points after 8 years. Average degradation after 3 years : ~+0.7 pts East/west bias after 3 years : ~0.3 index points GOME-2: scan-angle dependent degradation Degradation started directly after launch. If comparable to GOME-1, then there should be extreme reflectance degradation in 1-2 years. Average degradation after 3 years : ~–0.8 pts East/west bias after 3 years : ~1.4 pts (1.0 pts G1 swath) Expert Meeting on GOME-2 instrument degradation, KNMI, De Bilt, 04-03-2010
Extra slides (R) Expert Meeting on GOME-2 instrument degradation, KNMI, De Bilt, 04-03-2010
R1: Global mean per scan-mirror position, shifted to zero for t=0: [ indicated scan pixels only ] • growing east/west bias: ~1.4 index points in ~3 years Downward trend is for sure caused by instrument degradation; easternmost scan mirror positions are apparently affected in a different manner than the rest. Expert Meeting on GOME-2 instrument degradation, KNMI, De Bilt, 04-03-2010
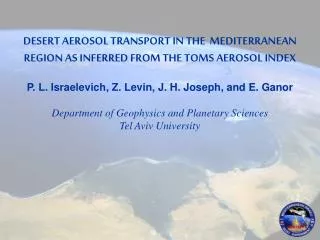
R2: Typical global aerosol distribution: The “Global Dust Belt”: Desert Dust Aerosols (DDA) (dust storms, all year) Biomass Burning Aerosols (BBA) (dry season, anthropogenic) AAI from other UV satellite instruments: TOMS, GOME-1, SCIAMACHY, OMI. Combined with GOME-2 there are more than three decades (1978–2009) of AAI data available for studies of trends in desert dust and biomass burning aerosol. Expert Meeting on GOME-2 instrument degradation, KNMI, De Bilt, 04-03-2010
R3: The “Global Dust Belt” Expert Meeting on GOME-2 instrument degradation, KNMI, De Bilt, 04-03-2010
R4: General impression of the global aerosol distribution reported by GOME-2: east/west bias is gone since PPF 4.0 Features at the eastern side of the swath at high latitudes are under investigation. Expert Meeting on GOME-2 instrument degradation, KNMI, De Bilt, 04-03-2010
R5: Global mean versus scanner mirror position: [also including backscan (BS) pixels] FW BS • global mean residue is roughly symmetrical w.r.t. the exact nadir position [ok] • growing east/west bias • behaviour of backscan pixels is not fully understood yet In conclusion, the GOME-2 AAI has shown to be reasonably stable over the last two years, but the need for a degradation correction is growing. Expert Meeting on GOME-2 instrument degradation, KNMI, De Bilt, 04-03-2010
R6: Kasatochi volcanic eruption on 7 August 2008: (Kasatochi, Aleutian Islands, 52.17°N, 175.51°W; summit 314 m) The ash plume resulting from the Kasatochi eruption was well captured by the GOME-2 AAI Expert Meeting on GOME-2 instrument degradation, KNMI, De Bilt, 04-03-2010