Download
1 / 47
470 likes | 616 Vues
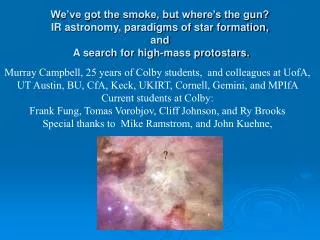
We’ve got the smoke, but where’s the gun? IR astronomy, paradigms of star formation, and A search for high-mass protostars. Murray Campbell, 25 years of Colby students, and colleagues at UofA, UT Austin, BU, CfA, Keck, UKIRT, Cornell, Gemini, and MPIfA Current students at Colby:

E N D
We’ve got the smoke, but where’s the gun? IR astronomy, paradigms of star formation, and A search for high-mass protostars. Murray Campbell, 25 years of Colby students, and colleagues at UofA, UT Austin, BU, CfA, Keck, UKIRT, Cornell, Gemini, and MPIfA Current students at Colby: Frank Fung, Tomas Vorobjov, Cliff Johnson, and Ry Brooks Special thanks to Mike Ramstrom, and John Kuehne, ?
Only on the largest cosmological scales is astronomy simple! The complexity you see here is only the beginning…
A new composite view of the Orion nebula. More beauty. More complexity. Hubble:Advanced Camera for Surveys Ground ESO-MPI 2.2m La Silla Filters:F435W (B) F555W (V) F658N (Ha) F775W (i) F850LP(z)ESO842 (B) ESO856 (Ha) ESO857 ([S II]) ESO859 ([O III])
The Simple Analysis Party is Busted! Interstellar H or H2 cloud in visible light: • Astronomy ought to be a study of atoms, gravity, nuclear physics, and newsworthy exotic forces. • Dust, clumpiness, and turbulence spoil the party. • The universe is 90% H, and clouds are mostly in H or H2, but you can’t see them in visible light. Shit Happens. Orion is a rare H+ = HII cloud (HII region)
Redeeming graces of Dust • Wavelength shifter and integrator: Absorbed light is re-emitted in IR. IR is often THE best estimator of luminosity! Great Observatories Origins Deep Survey
Figure 24-36Dusty Donut Chaisson and McMillan, Astronomy Today, 5th ed. (2005)
The Virial Theorem Rules Many Processes, including Star Formation • As an object collapses to a smaller size, the magnitude of its Gravitational Potential Energy gets bigger. • But only half of the kinetic energy released can go into heating the gas, or it violates the theorem. • If it can’t radiate, it can’t collapse!
Dust is a key player: I • H and H2 don’t radiate in most cloud conditions. • Dust can absorb energy from gas through collisions and radiate it in the IR. • Dust’s IR efficiency can keep the cloud at its ORIGINAL TEMPERATURE. • So the collapse is initially FREE FALL! • Density variations cause fragmentation into many cores.
Dust is a key player: II • Each collapse is inside out: a collapsing core becomes a protostar inside an envelope. • The outside envelope’s dust absorbs the protostar’s emission and reradiates it in the IR. • So we can find where the process is going on. • But the protostar itself may be obscured. Shit Happens.
Dust is a key player: III • In far-IR (50-200m), dust emission gives virtually total luminosity (power in watts). • In millimeter and submillimeter wavelengths, dust emission can be used to measure the mass of a molecular cloud, and its star forming cores.
Galaxies, Dust, and Starbursts Oops. I forgot to say that “naturally occurring” interstellar clouds are stable against collapse. The density is too low to have enough gravitational potential energy and the collisional coupling between gas and dust is too weak for dust cooling. They only become unstable with help from a compression, as happens in galactic collisions. Hubble close-up of a galactic collision that triggered star formation in NGC1275. The star formation is in the optically dark clouds.
A Brief History • The first observation of dust in emission was made by physicists who built IR detectors and put them on telescopes. • The first important far-ir source was the Galactic Center, discovered by a one-inch telescope on a high altitude balloon. • It’s luminosity comes largely from formation of high-mass stars. • The Infrared Astronomy Satellite (IRAS) discovered that many galaxies are strong IR emitters, especially colliding galaxies! The Galactic Center and plane of the the Milky Way at 100 m are shown in the background, but Spitzer is best for galaxies and low-mass stars.
More History… • The bright far-IR sources were all dust clouds around high-mass stars. • Radio astronomers mapping molecules’ rotation lines discovered incredible outflows! • The outflows were associated with low-mass protostars. Most astronomers focused on low-mass star formation.
Low-Mass Star Formation: Paradigms for the cloud core’s evolution. • The core is the most easily observed component • Before collapse, the core has uniform temperature, and density ~r-2, or something else. • A uniform core would experience a homologous collapse. • Dense parts collapse fastest. • A cloud forms many cores. • In each core, the protostar pulls away from the outer core: inside out-collapse. • Rotation is important…
A (Simplified) Realistic Model • An outer envelope, with density ~r-2. • A rotationally flattened infalling envelope with density determined by free fall, ~r-3/2. • An inner, flared accretion disk. • An outflow cavity. Barbara Whitney et al. 2003 ApJ 591, 1049
WHY SHOULD WE BELIEVE THE PARADIGM? • Jets are a natural consequence of rotation, even if hard to understand in detail. • Disks are observed. • Hydrodynamic models of collapsing clouds are roughly fit by observations. • Hydrodynamic models of protostars give reasonable luminosities due to gravitational contraction, accretion, and the onset of nuclear fusion. • Hydrodynamic models of accreting protostars are consistent with reasonable accretion rates. • Observed Spectral Energy Distributions (SEDs) can be explained by evolving disks and envelopes.
Interstellar Cloud Evolution Shown Explains a “Sequence” of SEDs Protostar Class 0/I Class II/III Star Chaisson and McMillan (2005)
Dust Far-ir continuum emission Mid-ir cont. emission and solid state bands mm and sub-mm cont. emission Ionized gas (HII regions) around young high-mass stars cm continuum mid-ir ionic lines [NeII] Molecular hydrogen, H2 Near-ir lines from shock fronts Molecules--thermal mm emission lines Velocity maps of outflows Velocity maps of disks Molecules--non-thermal (Masers) H2O CH3OH (methanol) SiO, OH, etc. Visible images of disks and jets around low-mass protostars Embedded low-mass young stars (YSOs) visible in near-ir If a protostar’s a gun, what forms does the smoke take?
So, what’s the problem for high-mass star formation? • Very high accretion rates are required. • Nuclear fusion should begin in the core before the outer layer is finished accretion from its parent cloud core. • Radiation pressure should stop accretion before a star can reach its final mass. • High-mass stars only form in clusters, so isolating individuals is difficult: Almost no HMPOs have been unambiguously identified at specific star-like points on the sky that can be easily observed in isolation from nearby already formed high-mass stars. • High-mass stars are rare, so high-mass protostars (HMPOs) are even less common, especially nearby. • HMPOs are more deeply embedded than low-mass counterparts, so there are no certain visible light images of disks and jets. • Obscuration by clumps of dense gas and dust make identification of individual protostars difficult. • No details are really pinned down in the process.
Why are HMPOs important? • High-mass stars dominate the luminosity of galaxies they are in. • High-mass stars’ nucleosynsthesis dominates the chemical evolution of galaxies, and the universe. • High-mass stars luminosities, outflows, and winds dominate the evolution of the interstellar medium, and hence on-going star formation.
What should we look for? • Sources of mid- and far-ir with a variety of sensible spectral energy distributions (SEDs). • Hot, high density molecular cores that are internally heated.
Evolution of SEDs Very approximate calculations by Cliff Johnson and me for high-mass protostars.
Color-Color Plots • The shapes of SEDs can be analysed by ratios of logs of photometric points. • Ratios of logs are proportional to differences in astronomical magnitudes, that are called “Color Indices” • “Color-Color” plots can be used to select classes of objects from a photometric database. Wood and Churchwell derived color-color criteria for deeply embedded high-mass stars with ultracompact HII regions (UC HIIs).[1989 ApJ, 340, 265)]
Criteria for sources: Detected in previous CS survey. IRAS IR colors meeting Wood and Churchwell UCHII region criteria. Bright in far-ir in IRAS survey. (IRAS F(60 m) > 90 Jy and F(100 m) > 500 Jy) Not detected in cm surveys for HII regions. (F(cm) < 25 mJy) Number satisfying criteria 69 Observations: Search for mid-ir sources in Midcourse Space Expreiment (MSX) archive. Search for cm emission at Very Large Array. Survey thermal molecular lines at Institut de Radioastronomie Millimetrique (IRAM) 30 m telescope and MPIfR Effelsberg 100m telescope . Search for masers at MPIfR Effelsberg 100m telescope. Map dust continuum at IRAM. Sridharan, Beuther, Schilke and Menten Survey of HMPOs I
Some Results: Derived Luminosities from IRAS. Found most sources in 18 MSX survey. Found some to be weak cm sources indicative of young UCHII regions. Found many with wide CO lines indicating outflows. Found many H20 and CH30H masers. Mapped all in 1.2 mm dust continuum. Sridharan, Beuther, Schilke and Menten Survey of HMPOs II
Why Follow-up Sridharan Survey on IRTF? • IRAS and MSX surveys were low resolution, with beams (1x5 and 18) covering whole proto-clusters, so hope to: • Identify individual HMPOs with beams of 1-2. (IRTF would primarily detect compact objects) • Determine statistics of HMPOs in each proto-cluster, the initial mass function (IMF). • Make approximate models of dust around each HMPO.
Observations at IRTF on Mauna Kea, Hawaii • In collaboration with Shridharan, Beuther, and MIRSI Team. • High sensitivity images at 10.4m covering about a square arc minute. • Images at 24.8m. • Low resolution “grism” spectra from 8-13m. • Telescope was controlled from my office 9/13-15/2003. • Frank Fung worked on planning and initial data processing. • Tomas Vorobjov helped with planning. • Frank, Glen Munkhold, and my wife kept logs during parts of the observations.
Criteria and Initial Results • Chose 1/3 of survey members with brightest, most compact MSX 12m emission. • Found compact sources in 18 of 23 fields. • Found multiple sources in 7 fields. • On average, brightest source in each field accounts for 40% of large beam flux. • Typical spectra have moderately deep silicate absorption.
Analysis in Progress • Studying two fields that have been mapped on the Plateau de Bure Interferometer (PdBI) or the Submillimeter Array (SMA) . • Reducing and analyzing spectra--begun by Ry Brooks. • Beginning to make approximate models of SMA sources--begun by Cliff Johnson.
IRAS 19410+2336 • Spitzer Space Telescope GLIMPSE IRAC Image • 4ox4o • Blue=3.6m Green=5.8m (H2) Red=8.0 m (PAH) Collaborator Joe Hora (CfA) has accessed the Spitzer database, and processed the IRAC images. Galactic Legacy Infrared Midplane Survey Extroidinaire PI: Ed Churchwell, Wisconsin
Shocked H2 and CO Outflows Our region of interest Our region of interest Beuther, Schilke& Stanke 2003A&A 408,601
Dust Continuum (1.2mm, 3 mm, 1.3mm) Beuther & Schilke 2004 Science 303, 1167
MM and Mid-IR Compared: Scales alligned Blue: IRAC 8m; Green IRTF 10.4m; Red IRTF 24.8m IRAC Positions Right: 1.3mm Plateau de Bure Interferometer
What is the optical depth of the dust in the mid-ir? • Absorption/emissivity properties of diffuse interstellar dust are dramatic function of wavelength. • Based on 1.2 mm dust emission, expect Av = 1000 in core. • Don’t expect to see any mid-ir at all! • Source might be on near edge of cloud core--would violate paradigm for high-mass star formation in center of core. • Source might be viewed through an outflow cavity aimed right at us. • Should try imaging disk at shorter ir (5m)! Li & Draine 2001 ApJ 554, 778
Why don’t we see a cluster of sources?Clump mass function looks like the Initial Mass Function--Maybe we see only the single brightest star. Fig. 2. The mass spectrum of IRAS 19410+2336. The clump-mass bins are [1.7(3),4], [4,6], [6,8], [8,10], and [10,25] M, and the axes are in logarithmic units. The error bars represent the standard deviation of a Poisson distribution . The solid line shows the best fit to the data N/MM–a, with a = 2.5. The dashed and dotted lines present the IMFs derived from Salpeter with a = 2.35 (15) and Scalo with a = 2.7 (17), respectively.
What about all the Shocked H2 and CO Outflows? Maybe they all go with the lower mass stars. Maybe the high-mass star has passed the outflow stage: There is a weak cm (UC HII region) near the brightest mm peak. But there are also an H2O maser and a CH3OH maser near the brightest mm peak. Originally observed in partly cloudy skies--to be observed on Gemini.
IRAS 18089-1732 • Spitzer Space Telescope GLIMPSE IRAC Image • 4ox4o • Blue=3.6m Green=5.8m (H2) Red=8.0 m (PAH) Collaborator Joe Hora (CfA) has accessed the Spitzer database, and processed the IRAC images. Galactic Legacy Infrared Midplane Survey Extroidinaire PI: Ed Churchwell, Wisconsin
IRAS 18089-1732 in Sub-mm • In mm and sub-mm dust continuum it’s only one source! • UC HII and H2O maser are at center. • CH3OH maser is offset from center. • There is a jet in SiO. • There is a disk in HCOOOCH3. Beuther et al.2004 ApJL 616, L23 Beuther et al. 2005 ApJ 628, 800. * is dust peak position.
Four Mid-IR Views of IRAS 18089-1732 The action’s here!
IRAS 18089-1732 in Sub-mm A B Beuther et al.2004 ApJL 616, L23 Beuther et al. 2005 ApJ 628, 800. * is dust peak position.
Cool Image! The image at source B clearly indicates a temperature gradient! But it does not fit well into any simple symmetry. And it does not indicate where the protostar is. A B Shit Happens!
Interpretation: • For now we’re stuck! • Maybe malicious cold clumps are causing the asymmetry, like the situation the famous BN/KL high-mass star forming region. • Ultimately, we have to interpret the SED of each HMPO.
Observed SEDs in IRAS 18089-1732 • IRAC and IRTF data suggest moderately deeply embedded source, not Av=1000 suggested by mm dust continuum. • Sources are on Gemini list for spectra and astrometry. • Ry started processing low resolution spectra of HMPOs between 8 and 13m. • Cliff is beginning to make spherically symmetric models to get rough estimates of the sizes and densities of the disks and envelopes.
Models of deeply embedded low-mass protostars for different angles of incidence suggest interpretations… Whitney, et al. 2003 ApJ 598, 1079
What have we learned? • A significant fraction of regions of high-mass star formation have a single, compact mid-ir source. • IR images of star formation regions are very hard to interpret. • SEDs are critically dependent on the model assumptions, e.g. orientation of the outflow cavity, and the shape and density of the disk. IRAS 19410 from GLIMPSE
What’s next? IRAS 18247-1147 from GLIMPSE • Studying high-mass star formation is like looking for a serial killer. • We’ve got to look at each crime scene (each HMPO’s images and spectrum), looking for commonalities and idiosyncrasies. • We need to make computer models that match the SED’s and image sizes as a way of estimating the physical conditions in the disks, the envelopes, and the outflows. • In the end, patterns will emerge that pin down details of the steps and their time scales. I hope! Next week, Dr. Lori Allen (CfA) will show more stunning Spitzer images and some of the successes in the study of low- mass star formation.