linear regression exponential and power law relationships
110 likes | 399 Vues
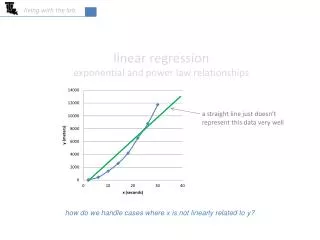
living with the lab. linear regression exponential and power law relationships. a straight line just doesn’t represent this data very well. how do we handle cases where x is not linearly related to y?. living with the lab.

linear regression exponential and power law relationships
E N D
Presentation Transcript
living with the lab linear regressionexponential and power law relationships a straight line just doesn’t represent this data very well how do we handle cases where x is not linearly related to y?
living with the lab • Class Problem Enter the data below into a spreadsheet, and complete the following activities: • Plot y versus x in Excel, and set the title of the plot to “linear y versus linear x” • Copy the plot from (a) to another part of your worksheet. Select the vertical axis on the copied plot, right click and select “format axis.” Select logarithmic scale, and change the title of this plot to “log y versus linear x” • Copy the plot from (b) to another part of your worksheet. Use a logarithmic axis for the horizontal axis, and change the title of the plot to “log y versus log x” www.epa.gov
living with the lab compare the three plots . . . do you notice anything special about any of these three plots? linear versus linear is a straight line linear spring: radioactive decay: log versus linear is a straight line exponential accelerating body: log versus log is a straight line power law
living with the lab living with the lab add trendlines & r2 to the previous plots. . . linear exponential power law • which one has the highest r2 value? • what does this mean? a power law relationship best describes the relationship between x and y
living with the lab math behind power law relationships logarithm rules take log of both sides plays part of b “log(y)” plays the part of “y” “log(x)” plays the part of “x” = 2.020 log 12.457
living with the lab rewriting equations for power law relationships equations for linear fits replace x with “log x” and y with “log y” equations for power law fits
living with the lab math behind exponential relationships logarithm rules take natural log (ln) of both sides “” plays the part of “y” plays part of b equations for exponential fits
living with the lab Class Problem The air that we breathe exerts a significant amount of pressure on objects at sea level (101.3 kPa or 14.7 psi). As we go higher into the atmosphere, the pressure decreases and eventually reaches zero in outer space where there is no air. Pressure measurements were recorded as a function of elevation above sea level resulting in the following table (km = kilometers and kPa = kilopascals):. Hand plot pressure versus elevation using linear-linear scales. Hand plot pressure versus elevation using log-linear scales. Hand plot pressure versus elevation using log-log scales. Based on your hand plots, what type of function is most appropriate (linear, exponential, power law)???? Create an Excel spreadsheet, and create a plot of the data along with a trendline showing r2 for linear, exponential and power law functions. Which has the highest r2? If you have time, manually compute m and b for this function using Excel. equations for exponential fits
living with the lab solution