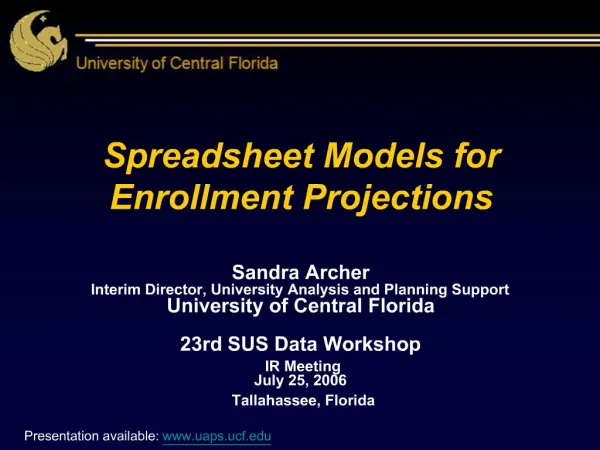
Spreadsheet Models for Enrollment Projections
UCF's Enrollment Projection Modeling Methods. 2. July 25, 2006. Goals for the Presentation. Share ideas for methods of developing enrollment projectionsUnderstand challenge of enrollment projections in a growth environmentDiscuss alternative modeling approachesNew insight into the use of SAS and Excel features to manage data and create reportsTake away: Sample Excel sheet models for your use.

Spreadsheet Models for Enrollment Projections
E N D
Presentation Transcript
1. Spreadsheet Models for Enrollment Projections Sandra Archer
Interim Director, University Analysis and Planning Support
University of Central Florida
23rd SUS Data Workshop
IR Meeting
July 25, 2006
Tallahassee, Florida
2. UCF's Enrollment Projection Modeling Methods 2 July 25, 2006 Goals for the Presentation Share ideas for methods of developing enrollment projections
Understand challenge of enrollment projections in a growth environment
Discuss alternative modeling approaches
New insight into the use of SAS and Excel features to manage data and create reports
Take away: Sample Excel sheet models for your use
3. UCF's Enrollment Projection Modeling Methods 3 July 25, 2006 The University of Central Florida Established in 1963 (first classes in 1968), Metropolitan Research University
Grown from 1,948 to 45,000 students in 37 years
38,000 undergrads and 7,000+ grads
Ten colleges
12 regional campus sites
7th largest public university in U.S.
89% of lower division and 67% of upper division students are full-time
4. UCF's Enrollment Projection Modeling Methods 4 July 25, 2006 Why Do Enrollment Modeling? Projecting income from tuition
Planning courses and curriculum
Allocating resources to academic departments
Long-term master planning
Strategic planning
Admissions policies
How accurate do these projections have to be?
See Hopkins, David S. P. and Massy, William F., Planning Models for Colleges and Universities, Stanford University Press, Stanford, CA, 1981 for additional information on enrollment planning
5. UCF's Enrollment Projection Modeling Methods 5 July 25, 2006 Enrollment Models Objective: find simplest model that predicts future enrollment based on past enrollment levels and new students enrolling
Methods
Regression (REG)
Grade progression ratio method (GPR)
Markov chain models (MC)
Cohort flow models (CF)
Notation
Nj(t) = number of students in state j at time t
fj(t) = number of students enrolling in state j at time t
j = state index�stands for class level
6. UCF's Enrollment Projection Modeling Methods 6 July 25, 2006 Regression Models Student inventory = predicted returning students plus expected new students
Prediction of returning students estimated by multivariate regression
N(t) = F[ Nj(t-1), fj(t-1), Nj(t-2), fj(t-2), � ] + f(t)
7. UCF's Enrollment Projection Modeling Methods 7 July 25, 2006 Grade Progression Ratio Ratio of students in one class level at time t to students in next-lower class level at time t-1
Assumes
Students follow an orderly progression form one state to another
All students in each state move on to next state in one time period or drop out of the system for good
Very simple model good for year-to-year projections
Data readily available
Not usable in higher education
Estimate the GPR from historical data
aj-1,j(t) = Nj(t)/ Nj-1(t-1)
Apply GPR to current enrollment level to predict next time period enrollment
8. UCF's Enrollment Projection Modeling Methods 8 July 25, 2006 Markov Chain Stochastic process
Fluctuate in time because of random events
System can be in various states
Markov property�each outcome depends only on the one immediately preceding it
Cross-sectional outlook
Transition fraction
pij = fraction of students in class i in one period that can be found in class j in the subsequent time period
9. UCF's Enrollment Projection Modeling Methods 9 July 25, 2006 Cohort Flow Models Adopt a longitudinal outlook
Take account of students� origins
Consider students� accumulated duration of stay
Students are grouped into cohorts at the time they enter the university (cohort survivor fractions)
Could be viewed as a special case of Markov chain model where states are expanded to include origin and length of stay
Cohorts typically defined for fall semester
Combine with semester transition fractions to generate annual estimate
10. UCF's Enrollment Projection Modeling Methods 10 July 25, 2006 Combined Cohort-Markov Model
11. UCF's Enrollment Projection Modeling Methods 11 July 25, 2006 Overall Enrollment Projection
12. UCF's Enrollment Projection Modeling Methods 12 July 25, 2006 UCF Approach Overall enrollment by level
Use combined cohort-Markov model for next five years
Use combined population and high school graduate growth rate projections for years 6 - 10 years
Enrollment and degrees by program
Conduct at major code level (degree & track)
Develop initial enrollment projections and degree projections
Programs conduct review of estimates and modify projections
Not conducted this year
13. UCF's Enrollment Projection Modeling Methods 13 July 25, 2006 UCF Approach
14. UCF's Enrollment Projection Modeling Methods 14 July 25, 2006 5-Year Model History
Initial development
Excel spreadsheet
Manual adjustments/overwrites to improve prediction
Historical data not updated
Needed an approach that would generate appropriate adjustment factors that would be useful for prediction, independent of manual fine tuning adjustments
Re-engineered in 2000
15. UCF's Enrollment Projection Modeling Methods 15 July 25, 2006 5-Year Model
Retained basic conceptual structure
Developed new spreadsheet structure
Updated data and formulas
Revised �unclass� HC to a weighted formula
Selection of �optimum� adjustment parameters for prediction of next year HC
Utilized multiplicative correction parameters
Annual update of historical input data
16. UCF's Enrollment Projection Modeling Methods 16 July 25, 2006 5-Year Model
Predicts headcount (HC)
Estimates student credit hours (SCH) from HC based on previous behavior
Estimates FTE from SCH (40 hrs UG, 32 hrs Grad)
17. UCF's Enrollment Projection Modeling Methods 17 July 25, 2006 Data Inputs to Determine HC New Student Input
Estimated HC of new students by type: (FTICs, CC Trans, Other Trans & Graduate)
By semester for five future years
Provided by administrators
New Undergraduate Student Allocation Fractions
Historical allocation of each entrant type of undergraduate students (FTIC, CCT, OT) to a student classification (Fresh, Soph, Jr, Sr)
Undergraduate Fall Retention Fractions
Historical surviving (fall to fall) undergraduate students from annual entering cohort
Ten years of entering cohorts
Average of the two most recent cohorts
Graduate Fall Continuation Fractions
Historical rate of graduate students continuing fall to fall (two-year average)
Computed only using the total number of graduate students; not cohort based
Semester Transition Fractions
Students by level allocated to student classifications in the subsequent semester
Spring to summer; Fall to spring
Summer to fall (new summer entrants)
18. UCF's Enrollment Projection Modeling Methods 18 July 25, 2006 5-Year Model Details Summer semester
Use Spring to Summer transition rate (from previous year) multiplied by previous Spring enrollments (data) by class plus new Summer students
Fall semester
Use Fall cohorts with �cohort retention in class� factors (based on student file) plus new Fall students plus continuing Summer students
Spring semester
Use Fall to Spring transition rate (from previous year) multiplied by Fall enrollments (modeled) by class plus new Spring students
19. UCF's Enrollment Projection Modeling Methods 19 July 25, 2006 5 Year Model
20. UCF's Enrollment Projection Modeling Methods 20 July 25, 2006 5-Year Model � Adjustment Parameter Determination Adjustment parameters
Existing approach [transition rate ci, group size Xi, and adjustment parameter ai ]
ciXi + ai
New approach
aiciXi
Select ai so that the predicted values for the previous year match the actual values
Minimize the squared deviations of the difference (predicted minus actual)
Implemented in Excel using Solver
21. UCF's Enrollment Projection Modeling Methods 21 July 25, 2006 Adjustment Parameter Optimization Setup
22. UCF's Enrollment Projection Modeling Methods 22 July 25, 2006 User Inputs: Allow for Adjustments
23. UCF's Enrollment Projection Modeling Methods 23 July 25, 2006 5-Year Model Output
24. UCF's Enrollment Projection Modeling Methods 24 July 25, 2006 5-Year Model Results � Predicted HC
25. UCF's Enrollment Projection Modeling Methods 25 July 25, 2006 5-Year Model Conclusions
Excel allows for �what if� analysis and adjustments
Model is fairly accurate in the short term; increasing error in future years
Based on historical student behavior
Data-driven process
Detail at student level and term
26. UCF's Enrollment Projection Modeling Methods 26 July 25, 2006 10-Year Projection Extension Model
Short-term detailed model projects t1 � t5
Extension model projects t6 � t10
Applies growth factor to t5 estimates to obtain t6 and repeats the process on an annual basis until t10 estimates are obtained
Lower, Upper, or Graduate growth factor
Average population growth and high school graduation growth
27. UCF's Enrollment Projection Modeling Methods 27 July 25, 2006 10-Year Projection Extension Model
Using the population and the high school graduate growth data, a composite annual growth rate was computed for each of the regions:
11-County Service Region
+ 4 counties
Other Florida
Method applied to FTIC, CC Trans, Other Trans, Graduate
28. UCF's Enrollment Projection Modeling Methods 28 July 25, 2006 10-Year Model: Population Growth
Population growth for Florida from Office of Economic and Demographic Research (http://edr.state.fl.us/)
Projections by county for persons in the 18-24 and 25-44 age groups
Growth rates vary by county, the relevant UCF growth rates were developed by focusing on the counties that are currently the primary source of the university�s students
Lower Level mostly First Time In College (FTIC) students
Upper Level mostly Community College Transfers (CCT)
Other transfers split between upper and lower
29. UCF's Enrollment Projection Modeling Methods 29 July 25, 2006 10-Year Model: High School Graduation
Graduation projections from Florida Department of Education (http://www.firn.edu/doe/evaluation/pdf/projhsgrad.pdf)
Overall growth rate accounts for the time since high school graduation until college entry
0 years for FTIC
2 years for CCT
4 years for Graduate
Combined to estimate the growth for Lower Level, Upper Level, and Graduate students
30. UCF's Enrollment Projection Modeling Methods 30 July 25, 2006 10-Year Model: Combined Growth
Time-adjusted growth factors using the average of the population-based and the high school-based growth rates
31. UCF's Enrollment Projection Modeling Methods 31 July 25, 2006 10-Year Model: Results
Growth factors applied to 5-year model output FTE and HC
32. UCF's Enrollment Projection Modeling Methods 32 July 25, 2006 10-Year Model Output
Regional campus growth rates provided by administration
Overall growth allocated to the campuses
33. UCF's Enrollment Projection Modeling Methods 33 July 25, 2006 10-Year Projection Extension Model
34. UCF's Enrollment Projection Modeling Methods 34 July 25, 2006 10-Year Model Conclusions Starts with detailed 5-year model output as a base
Applies high school graduation and population projections; weighted by the areas that supply our students
Regional growth allocation based on administrative input
Future developments
Workforce demand
Regional, web, and other trends
35. UCF's Enrollment Projection Modeling Methods 35 July 25, 2006 Program Enrollment Projection Model
36. UCF's Enrollment Projection Modeling Methods 36 July 25, 2006 Questions