Download

1 / 21
210 likes | 346 Vues
Structure Changes after High Power Tests Juwen Wang 5 th X-Band Structure Collaboration Meeting May 18, 2010. T18-SLAC #1 High Power Test The following 900hrs, maximum unloaded gradient is 120MV/m. Short pulse higher gradient condition. Pulse shape dependence BKD study.

E N D
Structure Changes after High Power Tests Juwen Wang 5th X-Band Structure Collaboration Meeting May 18, 2010
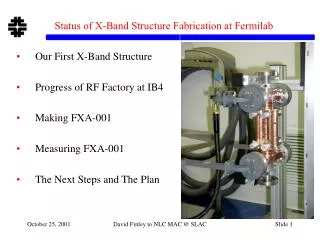
T18-SLAC #1 High Power Test The following 900hrs, maximum unloaded gradient is 120MV/m Short pulse higher gradient condition Pulse shape dependence BKD study. BKD pulse width dependence study at 110MV/m. BKD gradient dependence study at 230ns pulse width Faya Wang
Amplitude Measurement of T18-SLAC #1 Before and After High Power Test 11421.7 MHz at 21.32°C, N2 Before high Power test 11421.87 MHz at 20.4°C, N2 After high power test
Phase Measurement of T18-SLAC #1 Before and After High Power Test 11421.87 MHz at 20.4°C, N2 After high power test 11421.7 MHz at 21.32°C, N2 ore high Power test
Comments on T18-SLAC #1 Before and After High Power Test • From the Standing wave pattern, the output part was mismatched, it can be caused due to the “damage” by the high power test of backward feeding in order to compare with single cavity test. • In general, there was no frequency change of 2π/3 mode at similar operation condition. • CERN confirmation done. • The frequency of high power test was ~ 3 MHz higher than the tuned frequency. Because the structure is a nice band-pass filter, the field pattern and S12 almost no change. Only the mode phase advance was not 2π/3.
Amplitude Measurement of T18-KEK Before and After High Power Test 11421.7 MHz at 21.1°C, N2 Before high Power test 11422 MHz at 21.1°C, N2 After high power test
Phase Measurement of T18-KEK Before and After High Power Test 11421.7 MHz at 21.1°C, N2 Before high Power test Considering the string perturbation and temperature correction, the frequency was increased by 1.2 MHz (Toshi calculated 1.1 MHz). 11423.2MHz at 22.7deg°C in N2 After high power test
Comments on T18-KEK Before and After High Power Test • From the Standing wave pattern, the output part was damaged. • In general, there was a 1MHz frequency increase of 2π/3 mode at similar operation conditions. In another words, the cumulated phase drift was about 16° at frequency at similar operation conditions. • The total high power test time was 400 hours, is it a reason to cause more “damage” in comparison with T18-SLAC?
TD18-SLAC High Power Test Faya Wang
Phase Measurement of T18-KEK Before and After High Power Test 11424.56 MHz at 21.1°C, N2 After high power test 11424.5 MHz at 21.46°C, N2 Before high Power test 16.5° Select bead pulling frequencies based on the same measurement condition for both before and after high power test
Amplitude Measurement of TD18-SLAC Before and After High Power Test 11424.5 MHz at 21.46°C, N2 Before high Power test 11424.56 MHz at 21.1°C, N2 After high power test
Phase Measurement of TD18-SLAC Before and After High Power Test 11424.56 MHz at 21.1°C, N2 After high power test 11424.5 MHz at 21.46°C, N2 ore high Power test 16.5° Select bead pulling frequencies based on the same measurement condition for both before and after high power test
Comments on TD18-SLAC Before and After High Power Test • From the Standing wave pattern, the output part was mismatched. • In general, there was a 1MHz frequency increase of 2π/3 mode at similar operation conditions. In another words, the cumulated phase drift was about 16° at frequency at similar operation conditions • The pulse heating for TD18 structure is higher, but we believe the “damage” was still in the disc irises. • The total breakdown event recorded was more than 4000 – only twice higher than T18 SLAC #1, but the TD18 breakdown rate measured after 700 hours was higher than T18 SLAC #1 by factor of 100! The “damage” can be caused at higher power and full pulse width in stead of the process beginning with lower power and short pulse width.
Amplitude Measurement of T18-SLAC #1 Before and After High Power Test 11424.1 MHz at 20.02°C, N2 Before high Power test 11424.15 MHz at 20.4°C, N2 After high power test
Phase Measurement of T24-SLAC Before and After 800 Hours High Power Test 11424.1 MHz at 21.2°C, N2 Before high power test 11424.1 MHz at 21.1°C, N2 After high Power test 6º Select bead pulling frequencies based on the measurement condition to get 2π/3 phase advance for both before and after high power test
Frequency change +1MHz. Body temp change IQ amplitude dependence << MHz Rs reflection phase observed in T24-KEK structure Damage through operation if not due to change during vac bake? Rs phase 20110108~20110117,pulse width 252ns; Red point is ACC BD, green is 1st BD; Higo for US-HG 2011 at SLAC
Comments on T24 Before and After High Power Test • From the Standing wave pattern, the output part was mismatched. • In general, for SLAC there was a 0.3MHz frequency decrease of 2π/3 mode at similar operation conditions. In another words, the cumulated phase drift was about 6° at frequency at similar operation conditions, but different direction. • For KEK flanges structure there was a 1MHz frequency increase of 2π/3 mode at similar operation conditions. In another words, in the direction like most of structures.
Historical Information for the NLC/GLC Structures in Comparison Before and After High Power Tests <3° <2° <1.5° H90VG3N 1600 Hours RF on (65 MV/m, 400 ns) 9500 Body Breakdown T53VG3MC 900 Hours RF on (92MV/m., 400ns) 1600 Body Breakdown H60VG3R 1000 Hours RF on (65MV/m, 400ns) 8000 Body Breakdown
Bead-Pull Phase Advance Measurements of H60VG3 (FXB2) Before and After 300 Hours of Processing to 70 MV/m (7000 Breakdowns, 300 Hours RF On) Integrated Phase Advance (degrees) Cell Number
Comments on the History of NLC/GLC Structures Before and After High Power Test • There was no increased Standing wave pattern, the phase plots in output parts were used to fit together in order to compare the phase change before and after high power tests. • In general, there was a no frequency change for designed mode 2π/3 or 5π/6 at similar operation conditions. In another words, the cumulated phase drift for those long structures were very few degrees at frequency at similar operation conditions
Conclusion We need continue to pay close attention on the measurement and analysis the structure status before and after high gradient operation. It always is a critical issue for the life time and stabilization of the high gradient accelerating structures.