Download
1 / 29
290 likes | 431 Vues
Why do biological oceanographers care about planktonic protozoa (i.e., microzooplankton)? And why should the microbial loop be included in models of pelagic ecology??. Dian J. Gifford Graduate School of Oceanography University of Rhode Island Narragansett, RI, USA dgifford@gso.uri.edu

E N D
Why do biological oceanographers care about planktonic protozoa (i.e., microzooplankton)? And why should the microbial loop be included in models of pelagic ecology?? Dian J. Gifford Graduate School of Oceanography University of Rhode Island Narragansett, RI, USA dgifford@gso.uri.edu http://gso.uri.edu/faculty/gifford.html
Classical Linear Food Chain Phytoplankton Zooplankton Fish D.J. Gifford Imaging Laboratory Graduate School of Oceanography University of Rhode Island
CO2 CO2 POC Phytoplankton ? Bacteria Zooplankton Fish Protozoa ? DOC DOC Microbial Food Web Metazoan Food Web D.J. Gifford Imaging Laboratory Graduate School of Oceanography University of Rhode Island (Sherr & Sherr 1988)
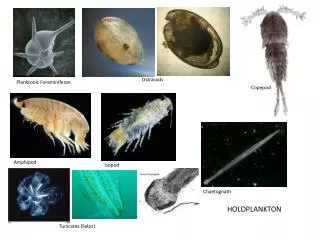
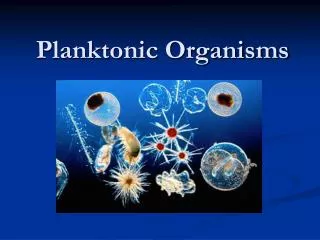
Major Taxa Nanozooplankton (2-20 m): Heterotrophic flagellates Ciliates Heterotrophic dinoflagellates Microzooplankton (20-200 m): Ciliates Heterotrophic dinoflagellates D.J. Gifford Imaging Laboratory Graduate School of Oceanography University of Rhode Island
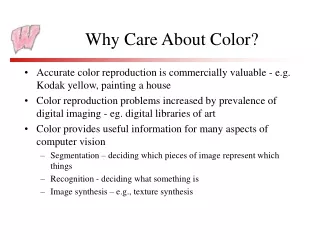
Ecological Functions of Planktonic Protozoa Primary Production: retention of functional chloroplasts; mixotrophy Nutrient Cycling: excretion fuels water column primary production Grazing: major source of phytoplankton and bacterial mortality Trophic Coupling: prey of higher trophic levels D.J. Gifford Imaging Laboratory Graduate School of Oceanography University of Rhode Island
Ciliates Containing Plastids or Endosymbionts D.J. Gifford Imaging Laboratory Graduate School of Oceanography University of Rhode Island
Contribution to Water Column Photosynthesis (Stoecker et al. 1990) D.J. Gifford Imaging Laboratory Graduate School of Oceanography University of Rhode Island
103 Protozoa 102 101 Nitrogen Excretion Rate (ug N/mg Dry Weight/d) 100 10-1 10-2 Metazoan Zooplankton 10-3 -10 -8 -6 -4 -2 0 2 Log Dry Weight (mg/organism) (Caron 1991) D.J. Gifford Imaging Laboratory Graduate School of Oceanography University of Rhode Island
GRAZING d [Chl]u [Chl]u ( k - a - m - s - g + x ) ~ 0 dt = mixing sinking grazing advection cell division horizontal terms D.J. Gifford Imaging Laboratory Graduate School of Oceanography University of Rhode island Imaging Laboratory Graduate School of Oceanography University of Rhode Island (Banse, 1992)
Protozoan Grazing Impact in Pelagic Ecosystems D.J. Gifford Imaging Laboratory Graduate School of Oceanography University of Rhode Island
Acartia tonsa Dana August September January 10 Clearance rate (ml/copepod/h) 5 0 1 2 3 4 5 6 7 Chl a 1 2 3 4 5 6 7 Chl a 1 2 3 4 5 6 7 Chl a 75 25 Ingestion rate (ngC/copepod/h) 15 0 1 2 3 4 5 6 7 Chl a 1 2 3 4 5 6 7 Chla 1 2 3 4 5 6 7 Chla Microplankton prey category Gifford and Dagg, 1988 Coastal Gulf of Mexico
Neocalanus plumchrus Marukawa Subarctic North Pacific 15 Ciliates Het. dionflagellates > 20 um Radiolarians Het. flagellates & dinoflagellates < 20 um 10 Phytoplankton Ingestion rate (ug C/copepod/d) Total 5 0 Mean ingestion Maximum ingestion Gifford, 1993
Calanus finmarchicus Georges Bank 1.0 Crest 0.5 0 1.0 Southern Flank Fraction Body C Ingested /d 0.5 0 1.0 Northeast Peak 0.5 0 Jan Feb/Mar Apr May June Phytoplankton Protozooplankton Gifford and Sieracki, submitted
Coastal Oregon Strong upwelling 40 30 20 Ingestion Rate (ug C/copepod/d) Relaxed upwelling 10 0 22 Jan 26 Feb 14 Apr 9 Jul 23 Jul 20 Aug 24 Jun Fessenden and Cowles, 1994
Chemical Composition Taxon C:N Reference Phytoplankton 6 Parsons et al. 1984 Heterotrophic flahgellates 4 - 7 Goldman et al. 1985 Borsheim & Bratbak 1987 Tintinnid ciliates 4 - 5 Verity & Langdon 1984 4 Stoecker & Sanders 1985 Oligotrich ciliates Mixotrophs 4 - 8 Putt & Stoecker 1989 Heterotrophs 3 - 4 Putt & Stoecker 1989
Chemical Composition Chemical Constituent Taxon Reference Lipids PUFAs Ciliates Aaronson & Baker 1961 Kaneshiro et al. 1979 Holz & Conner 1987 H dinoflagellates Harrington & Holz 1968 H flagellates Holtz & Connor 1987 Fatty acids H dinoflagellates Holtz & Connor 1987 H flagellates Holz & Connor 1987 Ciliates Sul & Erwin 1998 Sterols Ciliates Harvey et al. 1997 H flagellates Alam et al. 1984 Starch H dinoflagellatesHolz & Connor 1987 Ciliates Johnson et al. 1995 FAAsCiliates Kaneshiro et al. 1969
Significance: Effects on Consumers Effect Consumer Prey Reference Enhanced survivalEurytemora affinis Ciliates Berk et al. 1977 Daphnia pulex Ciliates Wickham et al. 1993 Daphnia magna Ciliates + Hflagellates DiBiase et al. 1990 Increased growth rateMegacyclops sp. nauplii Hflagellates Abdullahi 1992 Artemia salina Ciliates + Hflagellates Seki 1964 Increased reproductionAcartia tonsa Ciliates Stoecker & Egloff 1987 H dinoflagellates Kleppel & Burkart 1995 Eurytemora affinis Ciliates Heinle et al. 1977 Acartia clausi H dinoflagellates Breteler et al. 1980
Significance: Effects on Prey Populations Prey Population Consumer Cleared / day (%) Reference Eurytemora affinis 100 Sheldon et al. 1982 Acartia sp., Oithona sp. 50 Nielsen & Kiorboe 1981 Acartia tonsa 34-200 Dolan 1991 Artemia franciscana 99 Wurtsbaugh 1992 Neocalanus plumchrus 10-26 Gifford & Dagg 1991 Synchaeta littoralis 80 Arnat 1993
Mesozooplankton Taxa Feeding on Microzooplankton Suspension Feeding Copepods Acartia clausi (Ayukai 1987; Wiadnyana & Rassoulzadegan 1989; Broglio et al. 2001) Acartia hudsonica (Wiadnyana & Rassoulzadegan 1989) Acartia longiremis (Levinson et al. 2000) Acartia spp. (Batten et al. 2001) Acartia tonsa (Robertson 1983; Gifford & Dagg 1988; Stoecker & Egloff 1989; Jonsson & Tiselius 1990) Calanus finmarchicus (Gifford, submitted; Levinson et al. 2000) Calanus glacialis (Levinson et al. 2000) Calanus hyperboreus (Levinson et al. 2000) Calanus pacificus (Fessenden & Cowles 1994) Calanus propinquus (Atkinson 1995) Calanus spp. (Batten et al. 2001) Centropages typicus (Wiadnyana & Rassoulzadegan 1989) Centropages cherchiae (Batten et al. 2001) Centropages abdominalis (Fessenden & Cowles 1994) Clausocalanus spp. (Batten et al. 2001) Eucalanus pileatus (Verity & Paffenhofer 1996) Eurytemora affinis (Berk et al. 1977) Metridia gerlachei (Atkinson 1995) Neocalanus plumchrus (Gifford 1993) Neocalanus tonsus (Zeldis et al. 2002) Oithona spp. (Atkinson 1995) Pseudocalanus sp. (Fessenden & Cowles 1994) Para-pseudocalanus spp. (Batten et al. 2001) Decapod larvae Hemigrapsissanguinea (Gifford & O’Connor, unpubl.) Cancer magister (Sulkin et al. 1998) Miscellaneous crustaceans Balanus cf. Crenatus nauplii (Turner et al. 2001) Freshwater cladocera (Wickham & Gilbert 1991; Pace & Vaque 1994; Wiakowsji et a. 1994; Adrian & Schneider-Olt 1999) Bivalves Crassostrea gigas (Dupuy et al. 1999) Gelatinous zooplankton Aurelia aurita (Stoecker et al. 1987) Mnemiopsis leidyi (Stoecker et al. 1987; Sullivan & Gifford, submitted) Larval fish Theragra chalcogramma (Lessard et al. 1996; Nishiyama & Hirano 1985) Gadus morhua (Von Herbing & Gallager 2000))
Globec 01: Patterns of Energy Flow and Utilization on Georges Bank Funding:National Science Foundation: $1,500,000 Timeline: 2001-2005 Principal Investigator:Dian Gifford, University of Rhode Island Co-Investigators: James Bisagni, University of Massachusetts Jeremy Collie, University of Rhode Island Edward Durbin, University of Rhode island Michael Fogarty, NMFS, Woods Hole Jason Link, NMFS, Woods Hole Lawrence Madin, Woods Hole Oceanographic Institution David Mountain, NMFS, Woods Hole Debra Palka, NMFS, Woods Hole Michael Sieracki, Bigelow Laboratory for Ocean Science John Steele, Woods Hole Oceanographic Institution Barbara Sullivan, University of Rhode island
General Objective:To provide a broad ecosystem context for interpretation of the population dynamics of Georges Bank GLOBEC target species. Specific Objectives: Examine alternate model outcomes of GLOBEC and GLOBEC-related studies Examine the mechanisms forcing changing patterns of energy flow on Georges Bank With explicit consideration of factors not addressed in earlier models of the system: Sources and fates of new production The role of the microbial food web in production processes Secondary production processes, including the apparent secondary production deficit Changes in invertebrate and vertebrate predator species composition in the context of population dynamics of GLOBEC target organisms Effects of environmental forcing on production processes during contrasting (~decadal)time periods
Scientific approach: (1) Combine top-down [consumption-based models] and bottom-up [production-based models] approaches to describe Georges Bank food web (2) Use these analyses as a precursor to dynamic modeling Principal tools: Linear network analysis (Vezina, 1999; 2000) Nonlinear dynamical modeling (Collie and Delong 1999). Focus on two major issues: (1) Imbalance between primary production and fish production. “leakage hypothesis” v. microbial web dynamics (2) Magnitude of top-down [fish] v. bottom-up [microbial web] processes
Locations of three spatial domains on Georges Bank derived from an EOF mode 1 SST map (Bisagani et al. 2000). GBC=Georges Bank Crest. TMF = Tidal Mixing Front. GBSF = Georges Bank Southern Flank. Spatial domains change with season.
Temperature A B Salinity A. Spring (open bars) and fall (filled bars) bottom temperature anomalies for Georges Bank. The data are from NMFS spring (1968-2000) and fall (1963-2000) trawl surveys. The anomalies are referenced to the MARMAP data set (1977-1987). B. Spring (open bars) and fall (filled bars) salinity anomalies for Georges Bank. The data are from NMFS spring (1968-2000) and fall (1963-2000) trawl surveys. The anomalies are referenced to the MARMAP data set (1977-1987).
Changes in fish abundances on Georges Bank since the 1960s (Collie and Delong, 1999): Decreasing gadoids and flatfish Increasing pelagics and elasmobranchs
Temporal Stanzas:three time periods are defined on the basis of the historical temperature record: Seasons:three seasons are defined on the basis of mixing regime: September-April: well-mixed April-June: episodic stratification June-September: stratified
Pelagic Metazoan Food Web Elasmobranch Fish Pelagic Fish Physics + Climate Demersal Fish Birds & Mammals Vertebrate Predators Pre-Recruit Fish Benthic Food Web Macro- Benthos Large Invert Predators Invertebrate Predators Meso- Zooplankton (>200 um) Small Invert Predators Meio- Benthos NO3 Micro- Zooplankton (20-200 um) Bacteria Nano- and Micro-- Phytoplankton Nano-- Zooplankton (<20 um) Detritus Pelagic Microbial Food Web