Download
1 / 10
110 likes | 324 Vues
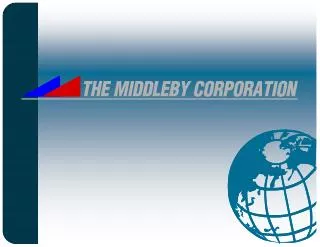
The Middleby Corporation. Financial Performance. Sales. Gross Profit. ($ in millions). ($ in millions). 30% CAGR. 35% CAGR. EBITDA. EPS. ($ in millions). 45% CAGR. 80% CAGR. Free Cash Flow. ($ in millions). Free Cash Flow 1. 46% 6-Yr CAGR. Significant free cash flow generation.

E N D
Financial Performance Sales Gross Profit ($ in millions) ($ in millions) 30% CAGR 35% CAGR EBITDA EPS ($ in millions) 45% CAGR 80% CAGR
Free Cash Flow ($ in millions) Free Cash Flow1 46% 6-Yr CAGR Significant free cash flow generation 1Free Cash Flow = EBITDA - Capital Expenditures
New Store Openings 33% Menu Changes 33% Replacement & Maintenance 34% Diverse and Stable Revenue Base Food Processing 10% Majority in international markets International Food Service 20% Institutional 10% Allows restaurants to differentiate themselves in a competitive market Independent 10% Casual 10% Domestic Food Service Pizza 10% Installed base of aged equipment in 850,000 establishments QSR 10% Fast Casual 20% End Market Product Use Stable, diversified revenue base with exposure to high growth end markets and limited exposure to new U.S. restaurant openings
Value Added Offering Customer Need Middleby Offering Revenue Protection Competitive Dynamics Cost Pressures The opportunity cost of a bad product can cripple a restaurant’s revenue. Equipment is used to compete effectively and lower customers’ most pressing costs. Middleby provides leading service with the industry’s best known brands. Middleby works with customers to introduce products that best meet their needs.
Limited Service Restaurant Unit Economics Illustrative Middleby Product Economics Value Added Offering (cont’d) % Sales • Investment $10,000 • Yearly Depreciation1,2 $1,428 • Yearly Savings • Food $800 • Labor $1,200 • Energy $3,600 $5,400 • Other Savings • Safety • Speed • Less Downtime • IRR3 50% • Payback period < 2 years Sales $2,200,000 100.0% Cost of Food & Beverage 638,000 29.0% Pitco Fryer: $10,000 Gross Profit 1,562,000 71.0% Salaries, Wages, Benefits 667,000 30.3% Life: 7 Years Direct Operating Expenses 106,000 4.8% $1,428 Marketing 46,000 2.1% Deprecation Per Year: $1,428 Utilities 68,000 3.1% Occupancy 163,000 7.4% Deprecation/Sales: 0.06% Repairs and maintenance 37,000 1.7% Depreciation 42,000 1.9% G&A 55,000 2.5% Other/Corporate Overhead 130,000 5.9% Operating Profit 249,000 11.0% Product represents 0.1% of cost structure, is immediately P&L accretive and provides attractive ROI/payback Source: National Restaurant Association; Deloitte & Touch; Management Estimates 1 Assumes straight-line depreciation over 7-years. Yearly annual depreciation is less than 0.1% of cost structure. 2 Minimal maintenance spend in first 2-3 years, $500 per year thereafter 3 Pre-tax and financing
Sales & Marketing • Strong relationships with dealers • Key partnerships w/leading chains • Only viable choice for many product categories • Emphasis on cross-selling Research & Development Acquisition Capability Service Management Team • Industry leading innovation process (“customer driving”) • Emphasis on quality • 6-8 new products each year • Ability to measure customer savings • Focus on leading brands • Ability to transform acquired companies • Preferred purchaser • Industry leading service • “No-quibble” 10-year warranty • Test kitchens throughout world • Combined 200 years in industry • Strong performance culture • Equity ownership of >10% Manufacturing • Efficient operations & use of capital allows for 80%+ ROTIC • 12 manufacturing facilities throughout the world • Focus on working capital management Competitive Advantage Global operating platform provides significant barriers to entry
Mini WOW! Oven Rethermalizer Solstice Supreme Fryer Redesigned Combi-Ovens 500 Series Range Tanduri Oven Revolving Tapinyaki Griddle 2007 Introductions 2008 Introductions New Product Pipeline – Foodservice • High H Oven • Hydrovection Oven • Rocket Fryer • Ventless Hood • Pressure Fryer • Visual Cooking Combi-Ovens • Samooza Fryer New products represent more than 20% of net sales
Cyclone Belt Oven Flash Pasteurization Mid-Size J-Con Oven Wireless Controls New Product Pipeline – Food Processing • Conveyor Fryer • Co-Extrusion • Forming Equipment • Intellijet Water Cutter 2007 Introductions 2008 Introductions New products typically carry profit margins >5% higher than existing products
Investment Highlights • Leading value-added manufacturer of hot commercial food service and processing equipment (#1 or #2 market share in each product) • Products are critical to customers, represent small portion of their budgets, and provide high ROIs • Unique global operating platform provides significant barriers to entry • U.S. restaurant sales have never declined • Diversified revenue base with exposure to high growth end markets • Focus on continued operational improvements and margin expansion • Successful track record of creating significant value through acquisitions • Long-term annual EPS growth target of 20%, consistent with historical performance • Proven senior management team with decades of industry experience