FY2020 Budget Update
190 likes | 309 Vues
This document outlines the significant factors impacting the FY2020 budget, focusing on enrollment trends, operating costs, and changes in funding. It highlights projections for elementary, middle, and high school enrollment growth, the financial implications of Exceptional Students Educational Programs (ESEP), and state budget influences. The proposed budget reflects a $659 million increase aimed at enhancing teacher salaries and adjustments in funding allocations. Critical considerations for revenue and expenditure influencers are summarized to assist in understanding the fiscal landscape for K-12 education.

FY2020 Budget Update
E N D
Presentation Transcript
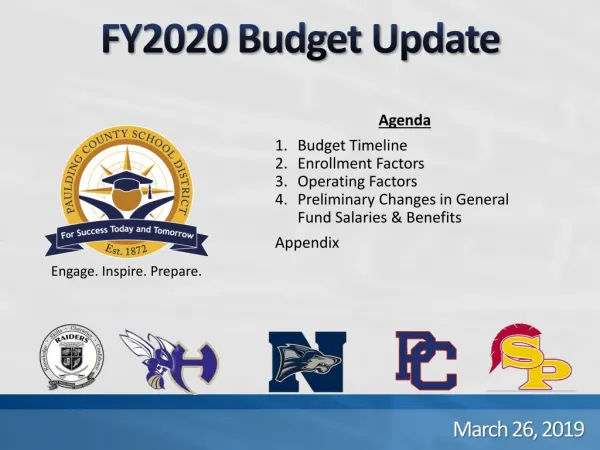
FY2020 Budget Update • Agenda • Budget Timeline • Enrollment Factors • Operating Factors • Preliminary Changes in General Fund Salaries & Benefits • Appendix Engage. Inspire. Prepare. March 26, 2019
Today April 23, 2019 Budget Outlook FY2020 Budget Approval Timeline 1 | Budget Timeline
Major Budget Influencers (MBI) must also be identified and considered within the framework, especially changes in funding and new or expanding influences on the budget, which may be positive or negative and short-term or long-term. • Major Revenue Influencers • Enrollment Growth • State Budget (Security Grant and Mental Health) • QBE: • Enrollment (Weighted) • Local Fair Share • Teacher Pay Scale • Equalization Grant: • Rollback Impact • Wealth per Weighted FTE • Changes in Local Sources: • Property Taxes (MR) • TAVT • Major Expenditure Influencers • Enrollment Growth • ESEP • State Teacher Scales (Local Impact) • Step Increases • TRS • Custodial Services • Bus Fleet Major Budget Influencers 1 | Budget Timeline
Organization-wide Factors Influencing Decisions: Enrollment Factors Engage. Inspire. Prepare.
District Enrollment Growth 2 | Enrollment
Elementary School Projections 2 | Enrollment Elementary School Growth: 13,283 Students an Increase of 168 or 1.3%
Middle School Projections Middle School Growth: 7,299 Students an Increase of 99 or 1.4% 2 | Enrollment
High School Projections High School Growth: 9,557 Students an Increase of 162 or 1.7% 2 | Enrollment
Enrollment Growth. In the 8 years preceding the collapse of the housing market, the district experienced tremendous enrollment growth, increasing over 80% from fiscal years 2000 to 2007. From 2008 to 2011 enrollment growth declined by two-thirds. By 2012, enrollment was declining, compared to modest increases statewide. From 2013 to 2019 enrollment grew 1,600 or 5.7%. 2019 enrollment grew 1.7%, the largest growth rate in a decade and much more than the large district average of 0.2%. 2020 is projected to grow 439 or 1.4%. District Enrollment Growth 2 | Enrollment
ESEP Enrollment Growth. Enrollment in Exceptional Students Educational Programs (ESEP) have increased dramatically over the past several years. In FY2018, the average additional cost per ESEP student was $2,134 or $8.9 million total. • 65% increase over the past 8 years verses -1% in non-ESEP • 14% greater cost (local and state sources) • Approximately $327 per pupil or $1.4 million is funded locally • 22% greater cost (local, state and federal sources) Enrollment Growth 2 | Enrollment Note: Total include Pre-K
Allotments: +29 School-Based +30 ESEP FY2020 Preliminary GF Allotments 72% Instruction 2,251 3 | GF Allotments
Organization-wide Factors Influencing Decisions: Operating Factors Engage. Inspire. Prepare.
T&E Certification • 31% Bachelor • 37% Masters • 27% Specialist • 67% Advanced Certification & Experience (QBE) • T&E Experience • 27% 0-8 Years • 24% 9-14 Years • 25% 15-20 Years • 24% +21 Years 3 | Operating Factor Based on October 2018 CPI Count
TRS Contributions 3 | Operating Factor TRS Contribution. Since FY2012, the Teacher Retirement System (TRS) contribution rate has increased 106%. The TRS budget for FY2019 is $32.6 million or approximately 12% of the total General Fund budget. These expenditures are funded with state and local resources.
FY2020 Preliminary GF Allotments 5 | Preliminary Changes
FY2020 Preliminary GF Allotments 5 | Preliminary Changes
Highlights of Proposed 2019 Amended Fiscal Year Budget for K-12 Education • $69 million, or 37 percent, is tied to the one-time school security grants. • Just under $90 million will be used for midterm adjustments to Quality Basic Education, or QBE. • $3.6 million for growth in the Dual Enrollment Program. • Highlights of Proposed 2020 Fiscal Year Budget for K-12 Education • 2020 budget for the GaDOE will increase about $659 million, or 6.6 percent, from the original FY2019 amount. • Most of the additional funds, $483 million, are directed to increase the base salary schedule for certified teachers and certified employees by $3,000. This amount will cover the raises and employer contribution to TRS for 133,000 employees. [Actual amounts and structure of the increase is still being developed] • A proposed boost of about $134 million covers student enrollment growth and routine adjustments in teachers’ salaries through the Quality Basic Education (QBE) formula, the state’s method for calculating K-12 funding. • Funding reductions are proposed for new math and science teachers, $1.5 million, and for school nurses, $110,468. • Increases in QBE are partially offset by a reduction of about $117 million under the Local Five Mill Share. • Funding for the equalization program, which provides supplemental funds to districts with low property wealth, would receive a $79 million increase. • Just over $2.5 million is allocated for pupil transportation. This amount will pay for a 2 percent salary increase for bus drivers and includes $818,906 for natural enrollment growth. • The Dual Enrollment Program is allocated an additional $3.5 million to meet projected need. • $20 million is allocated in bonds for school bus replacement. • HB329 TVAT Update • New formula splits TVAT revenue 65% to the local governments and 35% to the state. School districts will receive 49% of the local dollars. Effective July 1, 2019 State Budget Update 6 | State Budget Update Source: Georgia Budget and Policy Institute (GBPI)
Coming up: April 23, 2019 Revenue Projections FY2020 Budget Approval Timeline 1 | Budget Timeline
Thank YouFor Budget Ideas and Feedback:Visit our Website (Budget Ideas) orEmail Budget@Paulding.k12.ga.us Engage. Inspire. Prepare.