Download
1 / 8
80 likes | 207 Vues
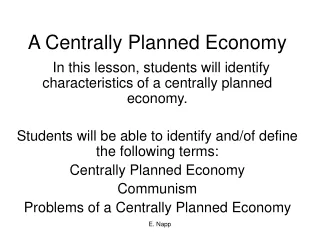
Allocation of centrally financed public spending. Persson & Tabellini (2004) Do the rules of election matter for level of redistribution ? Yes = PR = increased spending gmaj < g PR BUT: How does election rules matter for ” who gets what ”? i.e the allocation of public goods ?.

E N D
Allocationof centrally financedpublic spending Persson & Tabellini (2004) Do therulesofelection matter for levelofredistribution? Yes = PR = increased spendinggmaj < g PR BUT: Howdoeselectionrules matter for ”whogetswhat”? i.etheallocationofpublicgoods?
Situation in Norway • Disproportinalrepresentation • Electionrule part of rigid constitution • 159 representatives from 19 districtselected to parliament. • 150 district repr. • 9 ”smoothing repr.”
Norwaycont. • Principalpoint (historically): Districtswithlowervoter/populationdensity + longer distance from ”power” = higherrepresentation • Votes do not countthe same (1989-1997) Ifoslo = 1 Finnmark = 1,76 Buskerud = 0,92
The model Assumptions: Politicians maximizesdistrictrepresentation, not numberofvotesnationally Votersmaximizesconsumption and localpublicgoods, butalso have ideologicalpreferences. Hypotheses: Politicians willallocatepublicgoods to districtsthat offer more seats to parliament per voter in order to maximizedistrictrepresentation in Parliamentefficiently. Politicanswillchoosedistrictswithvotersthatareideologicalhomogenic and centered, a relative smallincrease in publicgoods, willshift a large nukberofvoters. Districtswithvoterswithhighideologicalvalues, and do not appricateconsumption or publicgoodswill be neglected/recievefewerlocalpublicgoods.
Local Public goods Examplesthat have been testet empirically (Norway):Road projects, militaryinstallations (Helland, Sørensen) This project: Transfers to subidize/fundinnovation, business R&D throughinstitution ”InnovationNorway” (Increasesemployment, tax base at locallevel) Principal Agent situation: Agent: InnovationNorway, Principal: Government. Agent’spreferences: ”Red” incumbant = highersubzidies, gov. interv, budgets. ”Blue” incumebant = market shouldinnovate, smallerbudgets
Modelaim • Dependent variable: Fundedprojects per capita/voter in district ”j” • Independent variables: Districtdemand variables (#newbusinesses, #bancrupcies, unemployment rate, eductioanlevel, univeristy present, incubatorfacilities, tradition, naturalresources) Swing voter variables Party identifiaction, voters at ideologicalcutpoint, voters per district representative) Control variables ??
Regression and pot hypo logPFPj per voter = c + log(Ddvar) + log(Svvar) + log(controls) + e Potentialhypotheses: H1 = Publicallyfundedprojectsincreases in districtsthat offer most district representatives for thefewestvotes to parliament H2 = Publicallyfundedprojectsdecreasewiththeshareofdistrictvotershavingstrong party identifycation H3 Red incumbant = increasedpublicallyfinancedprojects to red districts or ”weakblue” districts (low party id) Weexpect to findthatdistrictsthat offer more seats to Parliamentreceives more localpublicgoods
Discussion • Whatdeterminesinnovation? i.eWhataffectsdistrictdemand and directionofcoefficients? • Whatareapproriatecontrol variables? • How to do theanalysis?