
Introduction
Functional Networks and Cortical-Subcortical Interactions in Emotion: A Meta-Analysis of Neuroimaging Studies Hedy Kober 1 , Lisa Feldman Barrett 2 , Josh Joseph 1 , Eliza Bliss-Moreau 2 , Kristen Lindquist 2 , Tor D. Wager 1*

Introduction
E N D
Presentation Transcript
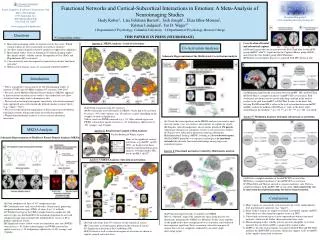
Functional Networks and Cortical-Subcortical Interactions in Emotion: A Meta-Analysis of Neuroimaging Studies Hedy Kober1, Lisa Feldman Barrett2, Josh Joseph1, Eliza Bliss-Moreau2, Kristen Lindquist2, Tor D. Wager1* 1 Department of Psychology, Columbia University 2 Department of Psychology, Boston College Social, Cognitive, & Affective Neuroscience Unit Dept. of Psychology 1190 Amsterdam Ave. 406 Schermerhorn Hall New York, NY 10027 Download this poster!! www.columbia.edu/cu/psychology/tor www.scan.psych.columbia.edu Questions THIS PAPER IS IN PRESS (NEUROIMAGE) *Corresponding author Co-activation of frontal and subcortical regions. Answer 1: MKDA Analysis: Cortical Activations Many human imaging studies of emotion activate the cortex. Which cortical regions are most consistently activated for emotion? Are these regions uniquely related to emotion (as opposed to cognition)? Most human studies focus on Amygdala. Do human imaging studies - like animal studies - reliably activate Periaqueductal Gray (PAG) and Hypothalamus (HY) activation? Can consistently-activated regions be separated into distinct functional networks? Which cortical regions, if any, are associated with PAG and HY? Co-Activation Analyses (A) Frontal regions that are co-activated with PAG. Dark blue for the mPFC group (dmPFC, rdACC), light blue for the Cognitive/Motor group (rFrOP), and red for the Core Limbic group (PAG/Thalamus). (B) Frontal cortical regions that are co-activated with HY (shown in red). Schematic Representation of the Multivariate Co-Activation Analysis Introduction • This is a quantitative meta-analysis of 162 neuroimaging studies of emotion (57 PET and 105 fMRI; yielding 437 contrasts) 1994-2005. • We used a novel Multilevel Kernel Density Analysis (MKDA) approach to find consistent activation across studies - this method does not allow activations from single study to dominate results. • We focused on locating brain regions consistently activated in emotional tasks aggregated across all semantically defined emotion category labels (e.g., “anger,” “fear”). • We assessed the functional organization of these regions into distributed functional networks using multivariate data-reduction methods. • We performed mediation analyses to assess cortical-subcortical interaction. (A) Mediation model for the association between dmPFC, HY, and PAG/Thal. (B) PAG/Thal is a complete mediator of dmPFC-HY co-activation. Path coefficients are shown next to arrows indicating each link in the analysis. a refers to the path from dmPFC to PAG/Thal. b refers to the direct link between PAG/Thal and HY. crefers to the total association between dmPFC and HY, without the mediator (PAG/Thal). c’ refers to the direct effect, controlling for the mediator. *, p < .05; **, p < .01; ***, p < .001, two-tailed. (A-C) Peak activations from 437 contrasts. (D-F) Consistently activated regions in MKDA. Voxels had to be activated by at least ~4% of the contrasts (e.g. 18 contrasts or more, depending on the weights) to achieve significance. Yellow voxels are FWER corrected at p < .05. Other colored regions are FWER corrected for spatial extent at p < .05 with primary alpha levels of .001 (orange), and .01(pink). Answer 5: Mediation Analyses of frontal-subcortical co-activation (A) Voxels that were significant in the MKDA analysis were used as input into new matrix: rows are contrasts, and columns are significant voxels. (B) Singular value decomposition on new matrix produced 172 parcels (functional subregions of contiguous voxels co-activated across studies). (C) Parcels were subjected to dimension reduction (Nonmetric Multidimensional Scaling; NMDS), resulting in 21 co-activated regions. (D) The NMDS procedure was repeated, resulting in a six functional networks that describe functional relationships among large-scale anatomical regions. MKDA Analysis Answer 2: Results from Cognitive Meta Analyses Van Snellenberg & Wager, in press Schematic Representation of Multilevel Kernel Density Analysis (MKDA) Many of the significant cortical activations (e.g. dmPFC, sgACC, OFC). are distinct from those found in cognition/attention meta analyses. Overlap found in IFG, , insula, preSMA, rdACC. Answer 4: Functional networks revealed by Multivariate analysis Answer 3: MKDA Analysis: Subcortical Activations (A) Thal is a complete mediator of the dmPFC-HY co-activation. (B) PAG is a complete mediator of the dmPFC-HY co-activation. (C) When PAG and Thal are entered as separate mediators, only PAG is a complete mediator of the dmPFC-HY co-activation. Such connectivity can become brain-based phenomenology for future characterization. Conclusions (A) Peak coordinates in three of 437 comparison maps. (B) Coordinates were each convolved with a 10mm kernel, generating comparison indicator maps (CIMs) of values 0 or 1 (1 in black). (C) Weighted average of the CIMs (weights based on sample size and analysis type) was thresholded by the maximum proportion of activated comparison maps expected under the null hypothesis (shown in D) to produce significant results. (E) Significant results: yellow voxels are familywise error rate (FWER) corrected at p < .05. Other colored regions are FWER corrected for spatial extent at p < .05 with primary alpha levels of .001 (orange), and .01(pink). Many regions are consistently activated across the cortex, independently from psychological categories (e.g. “anger”). Some of these regions are unique to emotion (core limbic regions, dmPFC) while others are often found in cognitive tasks (e.g. IFG). Consistently-activated regions can be separated into distinct functional networks, which can be further characterized in future work. Human imaging studies reliably activate not only Amygdala (as is often reported) but also PAG and HY, as proposed by animal studies. dmPFC is the only frontal regions associated with both PAG and HY. PAG mediates the dmPFC/HY association, which may suggest a role for dmPFC in the cognitive generation of emotion. (A-F) Six functional networks revealed by our NMDS. (G) A a “flattened” map of the connectivity space along the first two dimensions determined by NMDS (see Methods). Points closer together on the graph tend to have stronger positive co-activation, and connected lines represent significant Tau-b association values between pairs of regions that were not completely mediated by any other single intervening region. (A) Peak activations from 437 contrasts on the subcortical surface. (B) Consistently activated regions plotted on the subcortical surface. (C) Significant activations in the Cerebellum (CB). (D-F) Cortical as well as subcortical regions of activation are shown in sagittal, coronal, and axial slices.


