Download
1 / 29
290 likes | 291 Vues
This study analyzes the prevalence of obesity among U.S. adults from 1985 to 2010, using Body Mass Index (BMI) as a measure. The data shows the changing trends of obesity rates over time, with relevant statistics and percentages provided.

E N D
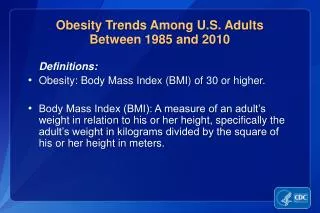
Obesity Trends - U.S. Adults (1985 – 2010) • Definitions: • Obesity: having a very high amount of body fat in relation to lean body mass, or Body Mass Index (BMI) of 30 or higher. • Body Mass Index (BMI): a measure of an adult’s mass in relation to their height, specifically the adult’s mass (kg) divided by the square of their height (m).
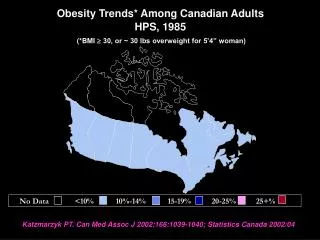
No Data <10% 10%–14% Obesity Trends* Among U.S. AdultsBRFSS, 1985 (*BMI ≥30, or ~ 30 lbs overweight for 5’ 4” person)
No Data <10% 10%–14% Obesity Trends* Among U.S. AdultsBRFSS, 1986 (*BMI ≥30, or ~ 30 lbs overweight for 5’ 4” person)
No Data <10% 10%–14% Obesity Trends* Among U.S. AdultsBRFSS, 1987 (*BMI ≥30, or ~ 30 lbs overweight for 5’ 4” person)
No Data <10% 10%–14% Obesity Trends* Among U.S. AdultsBRFSS, 1988 (*BMI ≥30, or ~ 30 lbs overweight for 5’ 4” person)
No Data <10% 10%–14% Obesity Trends* Among U.S. AdultsBRFSS, 1989 (*BMI ≥30, or ~ 30 lbs overweight for 5’ 4” person)
No Data <10% 10%–14% Obesity Trends* Among U.S. AdultsBRFSS, 1990 (*BMI ≥30, or ~ 30 lbs overweight for 5’ 4” person)
No Data <10% 10%–14% 15%–19% Obesity Trends* Among U.S. AdultsBRFSS, 1991 (*BMI ≥30, or ~ 30 lbs overweight for 5’ 4” person)
No Data <10% 10%–14% 15%–19% Obesity Trends* Among U.S. AdultsBRFSS, 1992 (*BMI ≥30, or ~ 30 lbs overweight for 5’ 4” person)
No Data <10% 10%–14% 15%–19% Obesity Trends* Among U.S. AdultsBRFSS, 1993 (*BMI ≥30, or ~ 30 lbs overweight for 5’ 4” person)
No Data <10% 10%–14% 15%–19% Obesity Trends* Among U.S. AdultsBRFSS, 1994 (*BMI ≥30, or ~ 30 lbs overweight for 5’ 4” person)
No Data <10% 10%–14% 15%–19% Obesity Trends* Among U.S. AdultsBRFSS, 1995 (*BMI ≥30, or ~ 30 lbs overweight for 5’ 4” person)
No Data <10% 10%–14% 15%–19% Obesity Trends* Among U.S. AdultsBRFSS, 1996 (*BMI ≥30, or ~ 30 lbs overweight for 5’ 4” person)
No Data <10% 10%–14% 15%–19% ≥20 Obesity Trends* Among U.S. AdultsBRFSS, 1997 (*BMI ≥30, or ~ 30 lbs overweight for 5’ 4” person)
No Data <10% 10%–14% 15%–19% ≥20 Obesity Trends* Among U.S. AdultsBRFSS, 1998 (*BMI ≥30, or ~ 30 lbs overweight for 5’ 4” person)
No Data <10% 10%–14% 15%–19% ≥20 Obesity Trends* Among U.S. AdultsBRFSS, 1999 (*BMI ≥30, or ~ 30 lbs overweight for 5’ 4” person)
No Data <10% 10%–14% 15%–19% ≥20 Obesity Trends* Among U.S. AdultsBRFSS, 2000 (*BMI ≥30, or ~ 30 lbs overweight for 5’ 4” person)
Obesity Trends* Among U.S. AdultsBRFSS, 2001 (*BMI ≥30, or ~ 30 lbs overweight for 5’ 4” person) No Data <10% 10%–14% 15%–19% 20%–24% ≥25%
Obesity Trends* Among U.S. AdultsBRFSS, 2002 (*BMI ≥30, or ~ 30 lbs overweight for 5’ 4” person) (*BMI 30, or ~ 30 lbs overweight for 5’4” person) No Data <10% 10%–14% 15%–19% 20%–24% ≥25%
Obesity Trends* Among U.S. AdultsBRFSS, 2003 (*BMI ≥30, or ~ 30 lbs overweight for 5’ 4” person) No Data <10% 10%–14% 15%–19% 20%–24% ≥25%
Obesity Trends* Among U.S. AdultsBRFSS, 2004 (*BMI ≥30, or ~ 30 lbs overweight for 5’ 4” person) No Data <10% 10%–14% 15%–19% 20%–24% ≥25%
Obesity Trends* Among U.S. AdultsBRFSS, 2005 (*BMI ≥30, or ~ 30 lbs. overweight for 5’ 4” person) No Data <10% 10%–14% 15%–19% 20%–24% 25%–29% ≥30%
Obesity Trends* Among U.S. AdultsBRFSS, 2006 (*BMI ≥30, or ~ 30 lbs. overweight for 5’ 4” person) No Data <10% 10%–14% 15%–19% 20%–24% 25%–29% ≥30%
Obesity Trends* Among U.S. AdultsBRFSS, 2007 (*BMI ≥30, or ~ 30 lbs. overweight for 5’ 4” person) No Data <10% 10%–14% 15%–19% 20%–24% 25%–29% ≥30%
Obesity Trends* Among U.S. AdultsBRFSS, 2008 (*BMI ≥30, or ~ 30 lbs. overweight for 5’ 4” person) No Data <10% 10%–14% 15%–19% 20%–24% 25%–29% ≥30%
Obesity Trends* Among U.S. AdultsBRFSS, 2009 (*BMI ≥30, or ~ 30 lbs. overweight for 5’ 4” person) No Data <10% 10%–14% 15%–19% 20%–24% 25%–29% ≥30%
Obesity Trends* Among U.S. AdultsBRFSS, 2010 (*BMI ≥30, or ~ 30 lbs. overweight for 5’ 4” person) No Data <10% 10%–14% 15%–19% 20%–24% 25%–29% ≥30%
Obesity Trends* Among U.S. AdultsBRFSS,1985, 1990, 1999, 2010 (*BMI 30, or about 30 lb overweight for 5’4” person) 1999 1985 2010 1990 No Data <10% 10%–14% 15%–19% 20%–24% 25%–29% ≥30%