
Uploaded by
ping
0 SLIDES
179 VUES
0LIKES
Systems Thinking
DESCRIPTION
Systems Thinking . Gerry Prody Chemistry. Youtube video of Nate Lewis giving an EXCELLENT ENERGY talk : http://www.youtube.com/watch?v=f1sYmBX7rNA. Where you are:.
Download

1 / 0
Télécharger la présentation 
Systems Thinking
An Image/Link below is provided (as is) to download presentation
Download Policy: Content on the Website is provided to you AS IS for your information and personal use and may not be sold / licensed / shared on other websites without getting consent from its author.
Content is provided to you AS IS for your information and personal use only.
Download presentation by click this link.
While downloading, if for some reason you are not able to download a presentation, the publisher may have deleted the file from their server.
During download, if you can't get a presentation, the file might be deleted by the publisher.
E N D
Presentation Transcript
- Systems Thinking Gerry Prody Chemistry
- Youtube video of Nate Lewis giving an EXCELLENT ENERGY talk : http://www.youtube.com/watch?v=f1sYmBX7rNA
- Where you are: advertising as an example of how communication uses coding and decoding of signs and symbols to persuade, and how that affects sustainability. how various spheres of influence interact and "bump up against each other" in the evolution of ideas. Hopefully that has served to foster a sense of the world of ideas as a world of interactive systems. Today: extend that idea of systems into the ways in which physical, chemical, and biological systems influence and interact and the connection between the ecology of ideas and the ecology of the planet. Next week: series on Sense of Place, understanding the idea of interdependent systems and the localization of these interdependencies in specific places and personal experiences...every place is a complex system.
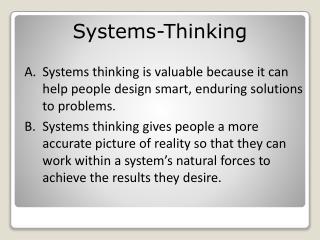
- Systems thinking: Systems thinking is the process of understanding how things influence one another within a whole. In nature systems thinking examples include ecosystems in which various elements such as air, water, movement, plant and animals work together to survive or perish.
- What is the world’s biggest problem??
- Perspective “Energy is the single most important challenge facing humanity today.” Nobel Laureate Rick Smalley, April 2004, Testimony to U.S. Senate ”..energy is the single most important scientific and technological challenge facing humanity in the 21st century..”: Chemical and Engineering News, August 22, 2005. “What should be the centerpiece of a policy of American renewal is blindingly obvious: making a quest for energy independence the moon shot of our generation“, Thomas L. Friedman, New York Times, Sept. 23, 2005. “The time for progress is now. .. it is our responsibility to lead in this mission”, Susan Hockfield, on energy, in her MIT Presidential Inauguration speech.
- “We are inertially adapted… …and that’s the WORST thing that I know.” -David Mason, “Blue Baroque”
- Units of Energy Energy Fundamental unit: Joule (J) Other units: BTU (British thermal units) 1 BTU = 1055 J thermodynamic calories 1 cal (thermo) = 4.18 J dietary calories 1 cal = 4,180 J therms (natural gas) 1 therm = 105,500,000 J One Joule is the amount of energy it takes to lift 1 Newton (~1/2 lb) by 1 meter (~3 ft). 1 meter
- Units of Energy Energy Fundamental unit: Joule (J) Stretched slinky 1 J Alkaline AA battery 10,000 J Big Mac 2,300,000 J 1 kg of 235U (nuclear bomb) 1015 J
- Units of Power Power Fundamental unit: Watt (W) = 1 J per sec. Other units: 1 horsepower = 746 W Power is the amount of energy expended per unit time. Energy (again) Common unit: kW = 1000 J / s x 3600 s = 3,600,000 J
- Units of Power LED 1 Watt Hair dryer 1000 Watt 103 W 1 kW Bugatti Veyron 1,000,000 Watt 106 W 1 MW Dr. Brown’s DeLorean 1,210,000,000 Watt 1.21x10⁹ W 1.21 GW
- Power Units: The Terawatt Challenge X 1000! X 1000! X 1000! X 1000! Notice where the lights are on! 103 106 109 1012 1 W 1 kW 1 MW 1 GW 1 TW Power Average electricity demand of world
- This picture was not all taken at once.. Over 2 billion people spending less than $1/day Last year the actual average TOTAL energy consumption rate was almost 15 TW! Of that, almost 4TW is expended in the US.
- Units of Power (especially useful ones to remember) One human (food only) 100 Watt Nuclear power plant 1,000,000,000 Watt 1x10⁹ W 1 GW Human species (2006) 15,700,000,000,000 Watt 1.57x10¹³ W 15.7 TW US Energy Information Administration
- Prefixes Kilo 1 thousand 1,000 103 Mega 1 million 1,000,000 106 Giga 1 billion 1,000,000,000 109 Terra 1 trillion 1,000,000,000,000 1012 Quad 1 million billion 1,000,000,000,000,000 1015 Exa 1 billion billion 1,000,000,000,000,000,000 1018 Total amount of solar energy striking planet = 3,850,000 exajoules / yr Total amount of energy capture by photosynthesis = 3,000 exajoules / yr (0.08%)
- World energy usage In 2006: Total energy usage: 15,700,000,000,000 W World population: 6,525,170,264 people = 2,400 W per person 2.4 hair dryers, 24 hrs/day x 7 days/wk CIA World Factbook (July, 2006)
- World energy usage - projections Over 15 TW US Energy Information Administration, 2006
- World energy usage 87% fossil fuel US Energy Information Administration, 2006
- Reasons to stop using fossil fuels Economic Geopolitical Running out Environmental Total US spending on fossil fuel imports EIA
- Running on empty? ”Hubbert Model” M. King Hubbert (1956) Recent books on the coming oil apocalypse This is just a model. It may be wrong, but, really, WHO CARES? Association for the Study of Peak Oil and Gas
- Running on empty? The stone age didn’t end because we ran out of stone…. 1Gulf Publishing Co., World Oil, Vol. 228, No.9 (September 2007) 2US Energy Information Administration, (December 2005)
- Burning fossil fuels CnHm + O2 CO2 + H2O + HEAT Fossil fuel air carbon dioxide water CO2 emitted per Joule1: 6.5 x 10⁻⁸ kg / J CO2 is a greenhouse gas 1Average for all fossil fuels
- Greenhouse effect
- Burning fossil fuels Fossil fuel burned each year: 4.3 x 10²⁰ J CO2 emitted per Joule burned: 6.5 x 10⁻⁸ kg / J Total CO2 potential emissions: 2.8 x 10¹³ kg / yr Total mass Earth’s atmosphere: 5 x 10¹⁸ kg Percent of Earth’s atmosphere: 0.0005% We may not run out of fossil fuels, but we will run out of AIR in which to put the waste.
- What if we burned it all? Total proven fossil fuel reserves : 3.7 x 10²² J CO2 emitted per Joule burned: 6.5 x 10⁻⁸ kg / J Total CO2 potential emissions: 2.4 x 10¹⁵ kg Total mass Earth’s atmosphere: 5 x 10¹⁸ kg Percent of Earth’s atmosphere: 0.05%
- So What’s The Fuss All About? We have enough fossil fuel for many generations. CO2 emissions represent a TINY fraction of the atmosphere.
- Problem: CO2 is accumulating We may not run out of fossil fuels, but we will run out of AIR in which to put the waste CO2 in present atmosphere: 0.0387% (387 ppm) Current annual contribution: 0.0005% (5 ppm) Just from Fossil fuels 2 ppm per yr About ½ of human-produced CO2 is taken up by the biosphere NOAA, globally averaged marine surface
- Observed changes in (a) global average surface temperature; (b) global average sea level from tide gauge (blue) and satellite (red) data; and (c) Northern Hemisphere snow cover for March-April. All differences are relative to corresponding averages for the period 1961-1990. Smoothed curves represent decadal averaged values while circles show yearly values. The shaded areas are the uncertainty intervals estimated from a comprehensive analysis of known uncertainties (a and b) and from the time series IPCC 2007 Assessment Report
- Goals for CO2 reduction A 1 C temperature rise is now inevitable. About 100 counties have adopted a 2 C temperature-rise target Requires: limiting total human emissions to about 3,000 billion tons of CO2 What matters is the cumulative emissions over human history. Considering just CO2 emissions from energy production. About 75% of human-produced CO2 comes from burning fossil fuels. Allen et al, Nature 458, 1163 (2009); Meinshausen et al. Nature, 458, 1158 (2009); US EIA
- Energy Consumption vs GDP GJ/capita-yr
- How will we generate 25 TW of carbon-free energy? More efficient usage Carbon capture & sequestration New methods of generation
- More energy hits the earth from the sun every hour than we need to power the planet FOR ONE YEAR!!! Total amount of solar energy striking planet = 3,850,000 exajoules / yr Total amount of energy capture by photosynthesis = 3,000 exajoules / yr (0.08%)
- Conservation If everyone in the US: Carpool, bike, public transport 1 TW 3 trillion 1.5 trillion miles = 50% reduction Toyota Prius 0.9 TW 17 mpg 50 mpg = 66% reduction Better insulation 0.08 TW 25% reduction Fluorescent lights 0.02 TW 25% reduction Planted a tree 0.001 TW 1,000,000 acres Total, USA 2 TW 90% of energy growth will come from non-OECD countries 50% from China + India IEA, 2005
- Conservation Projections already incorporate conservation Assume we keep current mix of energy sources, just more of each as population, economies grow Need to conserve 87% of all energy (all humans) (1 - 0.87) x 2400 W per person = 312 W per person 87% fossil fuel One human (food only) 100 Watt Worldwide Trends in Energy Use and Efficiency, IEA 2005
- How will we generate 25 TW of carbon-free energy? More efficient usage Carbon capture & sequestration New methods of generation
- Carbon capture and sequestration Reduce energy-related emissions by 45 billion tons CO2 / yr Forestation 1 - 3 metric tons CO2 per acre / yr 60M – 180 million km2 of new forest Earth land area: 150 million km2 Long-term results uncertain (CH4 ?) Ocean fertilization Uncertain & risky Underground / Underwater storage 1.5 metric tons / m3 30 km3 / yr Only 1/3 CO2 from centralized sources 40% of thermal energy to capture & dispose 3 km3 Pine forest, SE US.; 1 km2 = 247 acres
- Hoffert et al.’s Conclusions “These results underscore the pitfalls of “wait and see”.” Without policy incentives to overcome socioeconomic inertia, development of needed technologies will likely not occur soon enough to allow capitalization on a 10-30 TW scale by 2050 “Researching, developing, and commercializing carbon-free primary power technologies capable of 10-30 TW by the mid-21st century could require efforts, perhaps international, pursued with the urgency of the Manhattan Project or the Apollo Space Program.”
- How will we generate 25 TW of carbon-free energy? More efficient usage Carbon capture & sequestration New methods of generation
- How to reach 25 TW 10 15 20 5 0 25 Tides & waves Hydroelectric Biofuels Wind Geothermal Nuclear Solar TW E F
- How to reach 25 TW 10 10 15 15 20 20 5 5 0 0 25 25 Tides & waves Hydroelectric Biofuels Wind Geothermal Nuclear Solar TW TW E E F F Current capacity (2008): 0.0 TW Maximum theoretical capacity1: 0.1 TW (currents) : 3 TW (tidal) : 100 TW (waves) Maximum feasible capacity: 0.5 TW Requires 2% of world’s coastline Isaacs & Schmitt, Science 207, 265 (1980); Sims, MRS Bull. 333, 389 (2008); Pelamis Wave Power Inc.
- How to reach 25 TW 10 10 15 15 20 20 5 5 0 0 25 25 Tides & waves Hydroelectric Biofuels Wind Geothermal Nuclear Solar TW TW E E F F 45,000 large dams worldwide $0.03 – 0.10 per kW-hr Cheap, so already well developed Current generating capacity: 0.8 TW Maximum theoretical: 10 TW If all run-off worldwide was “turbined” to sea level Maximum feasible from hydroelectric: 2.5 TW Dams on all remaining rivers Three Gorges Dam, China 18 GW Schiermeier et al, Nature 454, 816 (2008); World Energy Council; International hydropower association; Sims, MRS Bull. 333, 389 (2008).
- How to reach 25 TW 10 10 15 15 20 20 5 5 0 0 25 25 Tides & waves Hydroelectric Biofuels Wind Geothermal Nuclear Solar TW TW E E F F Photosynthesis is highly inefficient (<1%) Requires significant energy inputs Current capacity: 0.3 TW Maximum theoretical: 8 - 14 TW Based on 4 – 7 million km2 of suitable land available for rain-fed biomass = ½ area of US Maximum feasible net: 2 TW (1) OECD round table on sustainable development, 2007; (2) IPCC
- How to reach 25 TW 10 10 15 15 20 20 5 5 0 0 25 25 Tides & waves Hydroelectric Biofuels Wind Geothermal Nuclear Solar TW TW E E F F Current capacity (2008): 0.1 TW Maximum theoretical capacity1: 70 TW Requires 13% of all land on earth Maximum feasible capacity: 5 TW Requires 1% of all land on earth 200,000 windmills (1) Archer & Jacobson J. Geophys. Res. 110, D12110; 2005; (2) IPCC
- How to reach 25 TW 10 10 15 15 20 20 5 5 0 0 25 25 Tides & waves Hydroelectric Biofuels Wind Geothermal Nuclear Solar TW TW E E F F Current capacity (2008): 0.01 TW Maximum theoretical capacity: 45 TW Total radiated energy from the Earth’s core Maximum feasible capacity: 0.1 TW Tester et al, “The Future of Geothermal Energy” (2006)
- How to reach 25 TW 10 10 15 15 20 20 5 5 0 0 25 25 Tides & waves Hydroelectric Biofuels Wind Geothermal Nuclear Solar TW TW E E F F 450 nuclear plants worldwide 5M metric tons of proven Uranium reserves + 30M (?) undiscovered = 80 years worth proven at current use rate Breeder reactors reduce fuel use by 60-fold Current generating capacity 0.4 GW Maximum theoretical: > 25 TW Maximum feasible: 1 TW = 600 new reactors = 1 per month for 50 years Three mile island Schiermeier et al, Nature 454, 816 (2008); International Atomic Energy Agency Deutch & Moniz, Interdisc. MIT Study on Future of Nucl. Power (2003)
- How to reach 25 TW 10 10 15 15 20 20 5 5 0 0 25 25 Tides & waves Hydroelectric Biofuels Wind Geothermal Nuclear Solar TW TW E E F F Current capacity (2008): 0.01 TW $0.25 per kWh Maximum theoretical capacity: 12,000 TW 800 W m-2 solar energy at Earth’s surface Using all land area, 10% efficiency Maximum feasible capacity: > 100 TW Using 1% of land area, 10% efficiency Roughly 6 m2 of solar panels per person provides all needed power Covering the areas indicated by black circles with 8$ efficient PVs would provide 18 TW of electricity, equal to total world energy consumption Philip Eames, Loughborough Univ.
- Summary Eventually fossil fuel usage will cease: run out economic reasons geopolitical reasons global climate change To limit global warming to 2 C, must replace 25 TW of energy, 45 Gt/yr CO2 Conservation Capture & sequestration Renewable generation methods Will require new technologies new materials Your generation will solve these problems
- Biomass Solar Ocean Hydroelectric Wind Geothermal
- Hydroelectric Gross: 4.6 TW Technically Feasible: 1.6 TW Economic: 0.9 TW Installed Capacity: 0.6 TW
- Geothermal Mean flux at surface: 0.057 W/m2 Continental Total Potential: 11.6 TW
- Wind 4% Utilization Class 3 and Above 2-3 TW
- Ocean Energy Potential
- Biomass 50% of all cultivatable land: 7-10 TW (gross) 1-2 TW (net)
- Biomass Energy Potential Global: Bottom Up Land with Crop Production Potential, 1990: 2.45x10¹³ m2 Cultivated Land, 1990: 0.897 x10¹³ m2 Additional Land needed to support 9 billion people in 2050: 0.416x10¹³ m2 Remaining land available for biomass energy: 1.28x10¹³ m2 At 8.5-15 oven dry tonnes/hectare/year and 20 GJ higher heating value per dry tonne, energy potential is 7-12 TW Perhaps 5-7 TW by 2050 through biomass (less CO2 displaced) Possible/likely that this is water resource limited 25% of U.S. corn in 2007 provided 2% of transportation fuel
- Solar: potential1.2x105 TW; practical > 600 TW
- Solar Energy Potential Theoretical: 1.2x10⁵ TW solar energy potential (1.76 x10⁵ TW striking Earth; 0.30 Global mean albedo) Energy in 1 hr of sunlight 14 TW for a year Practical: > 600 TW solar energy potential (50 TW - 1500 TW depending on land fraction etc.; WEA 2000) Onshore electricity generation potential of ≈60 TW (10% conversion efficiency): Photosynthesis: 90 TW
- Solar Land Area Requirements 3 TW
- Conclusions Abundant, Inexpensive Resource Base of Fossil Fuels Renewables will not play a large role in primary power generation unless/until: –technological/cost breakthroughs are achieved, or –unpriced externalities are introduced (e.g., environmentally driven carbon taxes)
- Problem: CO2 is accumulating Atmospheric concentration of CO2 over the last 10,000 years (large panel) and since 1750 (inset panel). Measurements are shown from ice cores (symbols with different colors for different studies) and atmospheric samples (red lines). The corresponding radiative forcings relative to 1750 are shown on the right hand axes of the large panels. IPCC 2007 Assessment Report
- Back-testing climate models Computer models provide the best evidence that CO2 causes climate change. Two conclusions: Models are now fairly accurate Human causes are evident IPCC 2007 Assessment Report
- Goals for CO2 reduction Must replace 25 TW of power production. AND Eliminate 45 GT/yr of CO2 emissions. US EIA


More Related