EXPECTATION, VARIANCE ETC. - APPLICATION
Understand how central location and variability measures work in data analysis, from calculating mean, median, mode to variance and range. Learn their significance in describing population traits.

EXPECTATION, VARIANCE ETC. - APPLICATION
E N D
Presentation Transcript
Measures of Central Location • Usually, we focus our attention on two types of measures when describing population characteristics: • Central location • Variability or spread
With one data point clearly the central location is at the point itself. Measures of Central Location • The measure of central location reflects the locations of all the data points. • How? With two data points, the central location should fall in the middle between them (in order to reflect the location of both of them). But if the third data point appears on the left hand-side of the midrange, it should “pull” the central location to the left.
Sum of the observations Number of observations Mean = The Arithmetic Mean • This is the most popular measure of central location
The Arithmetic Mean Sample mean Population mean Sample size Population size
The Arithmetic Mean • Example The reported time on the Internet of 10 adults are 0, 7, 12, 5, 33, 14, 8, 0, 9, 22 hours. Find the mean time on the Internet. 0 7 22 11.0
The Arithmetic Mean • Drawback of the mean: It can be influenced by unusual observations, because it uses all the information in the data set.
Example Find the median of the time on the internetfor the 10 adults of previous example Suppose only 9 adults were sampled (exclude, say, the longest time (33)) Comment Even number of observations 0, 0, 5, 7, 8,9, 12, 14, 22, 33 The Median • The Median of a set of observations is the value that falls in the middle when the observations are arranged in order of magnitude. It divides the data in half. Odd number of observations 8 8.5, 0, 0, 5, 7, 89, 12, 14, 22 0, 0, 5, 7, 8,9, 12, 14, 22, 33
The Median • Depth of median = (n+1)/2
The Mode • The Mode of a set of observations is the value that occurs most frequently. • Set of data may have one mode (or modal class), or two or more modes. The modal class
The Mode • Find the mode for the data in the Example. Here are the data again: 0, 7, 12, 5, 33, 14, 8, 0, 9, 22 Solution • All observation except “0” occur once. There are two “0”s. Thus, the mode is zero. • Is this a good measure of central location? • The value “0” does not reside at the center of this set(compare with the mean = 11.0 and the median = 8.5).
Relationship among Mean, Median, and Mode • If a distribution is from a bell shaped symmetrical one, the mean, median and mode coincide Mean = Median = Mode • If a distribution is asymmetrical, and skewed to the left or to the right, the three measures differ. A positively skewed distribution (“skewed to the right”) Mode < Median < Mean Mode Mean Median
Relationship among Mean, Median, and Mode • If a distribution is non symmetrical, and skewed to the left or to the right, the three measures differ. A negatively skewed distribution (“skewed to the left”) A positively skewed distribution (“skewed to the right”) Mode Mean Mean Mode Median Mean < Median < Mode Median
Measures of variability • Measures of central location fail to tell the whole story about the distribution. • A question of interest still remains unanswered: How much are the observations spread out around the mean value?
Measures of variability Observe two hypothetical data sets: Small variability The average value provides a good representation of the observations in the data set. This data set is now changing to...
Measures of Variability Observe two hypothetical data sets: Small variability The average value provides a good representation of the observations in the data set. Larger variability The same average value does not provide as good representation of the observations in the data set as before.
? ? ? The Range • The range of a set of observations is the difference between the largest and smallest observations. • Its major advantage is the ease with which it can be computed. • Its major shortcoming is its failure to provide information on the dispersion of the observations between the two end points. But, how do all the observations spread out? The range cannot assist in answering this question Range Smallest observation Largest observation
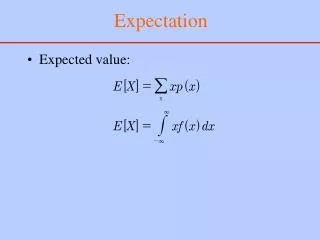
This measure reflects the dispersion of all the observations • The variance of a population of size N x1, x2,…,xN whose mean is m is defined as • The variance of a sample of n observationsx1, x2, …,xn whose mean is is defined as The Variance
Sum = 0 Sum = 0 Why not use the sum of deviations? Consider two small populations: 9-10= -1 A measure of dispersion Should agrees with this observation. 11-10= +1 Can the sum of deviations Be a good measure of dispersion? The sum of deviations is zero for both populations, therefore, is not a good measure of dispersion. 8-10= -2 A 12-10= +2 8 9 10 11 12 …but measurements in B are more dispersed than those in A. The mean of both populations is 10... 4-10 = - 6 16-10 = +6 B 7-10 = -3 13-10 = +3 4 7 10 13 16
The Variance Let us calculate the variance of the two populations Why is the variance defined as the average squared deviation? Why not use the sum of squared deviations as a measure of variation instead? After all, the sum of squared deviations increases in magnitude when the variation of a data set increases!!
The Variance Let us calculate the sum of squared deviations for both data sets Which data set has a larger dispersion? Data set B is more dispersed around the mean A B 1 2 3 1 3 5
SumA = (1-2)2 +…+(1-2)2 +(3-2)2 +… +(3-2)2= 10 SumB = (1-3)2 + (5-3)2 = 8 The Variance SumA > SumB. This is inconsistent with the observation that set B is more dispersed. A B 1 3 1 2 3 5
The Variance However, when calculated on “per observation” basis (variance), the data set dispersions are properly ranked. sA2 = SumA/N = 10/5 = 2 sB2 = SumB/N = 8/2 = 4 A B 1 3 1 2 3 5
The Variance • Example • The following sample consists of the number of jobs six students applied for: 17, 15, 23, 7, 9, 13. Find its mean and variance • Solution
Standard Deviation • The standard deviation of a set of observations is the square root of the variance.
Standard Deviation • Example • To examine the consistency of shots for a new innovative golf club, a golfer was asked to hit 150 shots, 75 with a currently used (7-iron) club, and 75 with the new club. • The distances were recorded. • Which club is better?
Standard Deviation • Example – solution Excel printout, from the “Descriptive Statistics” sub-menu. The innovation club is more consistent, and because the means are close, is considered a better club
The Coefficient of Variation • The coefficient of variation of a set of measurements is the standard deviation divided by the mean value. • This coefficient provides a proportionate measure of variation. A standard deviation of 10 may be perceived large when the mean value is 100, but only moderately large when the mean value is 500
Percentiles • Example from http://www.ehow.com/how_2310404_calculate-percentiles.html • Your test score, e.g. 70%, tells you how many questions you answered correctly. However, it doesn’t tell how well you did compared to the other people who took the same test. • If the percentile of your score is 75, then you scored higher than 75% of other people who took the test.
Sample Percentiles and Box Plots • Percentile • The pth percentile of a set of measurements is the value for which • p percent of the observations are less than that value • 100(1-p) percent of all the observations are greater than that value.
Sample Percentiles • Find the 10 percentile of 6 8 3 6 2 8 1 • Order the data: 1 2 3 6 6 8 8 • 7*(0.10) = 0.70; round up to 1 The first observation, 1, is the 10 percentile.
Commonly used percentiles • First (lower) quartile, Q1= 25th percentile • Second (middle) quartile,Q2 = 50th percentile • Third quartile, Q3 = 75th percentile • Fourth quartile, Q4 = 100th percentile • First (lower) decile = 10th percentile • Ninth (upper) decile = 90th percentile
Quartiles and Variability • Quartiles can provide an idea about the shape of a histogram Q1 Q2 Q3 Q1 Q2 Q3 Positively skewed histogram Negatively skewed histogram
Interquartile Range • Large value indicates a large spread of the observations Interquartile range = Q3 – Q1
Paired Data Sets and the Sample Correlation Coefficient • The covariance and the coefficient of correlation are used to measure the direction and strength of the linear relationship between two variables. • Covariance - is there any pattern to the way two variables move together? • Coefficient of correlation - how strong is the linear relationship between two variables
x (y) is the sample mean of the variable X (Y). n is the sample size. Covariance mx (my) is the population mean of the variable X (Y). N is the population size.
Covariance • If the two variables move in the same direction, (both increase or both decrease), the covariance is a large positive number. • If the two variables move in opposite directions, (one increases when the other one decreases), the covariance is a large negative number. • If the two variables are unrelated, the covariance will be close to zero.
Covariance • Compare the following three sets
The coefficient of correlation • This coefficient answers the question: How strong is the association between X and Y?
The coefficient of correlation +1 0 -1 Strong positive linear relationship COV(X,Y)>0 or r or r = No linear relationship COV(X,Y)=0 COV(X,Y)<0 Strong negative linear relationship
The Coefficient of Correlation • If the two variables are very strongly positively related, the coefficient value is close to +1 (strong positive linear relationship). • If the two variables are very strongly negatively related, the coefficient value is close to -1 (strong negative linear relationship). • No straight line relationship is indicated by a coefficient close to zero.
Correlation and causation • Recognize the difference between correlation and causation — just because two things occur together, that does not necessarily mean that one causes the other. • For random processes, causation means that if A occurs, that causes a change in the probability that B occurs.
Correlation and causation • Existence of a statistical relationship, no matter how strong it is, does not imply a cause-and-effect relationship between X and Y. for ex, let X be size of vocabulary, and Y be writing speed for a group of children. There most probably be a positive relationship but this does not imply that an increase in vocabulary causes an increase in the speed of writing. Other variables such as age, education etc will affect both X and Y. • Even if there is a causal relationship between X and Y, it might be in the opposite direction, i.e. from Y to X. For eg, let X be thermometer reading and let Y be actual temperature. Here Y will affect X.
Example Dr. Leonard Eron, professor at the University of Illinois at Chicago, has conducted a longitudinal study of the long–term effects of violent television programming. In 1960, he asked 870 third grade children their favorite television shows. He found that children judged most violent by their peers also watched the most violent television. Dr. Eron noted, however, that it was not clear which came first — the child’s behavior or the influence of television. In follow-up interviews at ten–year intervals, Eron found that youngsters who at age eight were nonaggressive but were watching violent television were more aggressive than children who at age eight were aggressive and watched non–violent television. Eron claims that this establishes a cause–and–effect relationship between watching violent television and aggressive behavior. Can you think of any other possible causes?
Example - solution • It could be that the difference in aggressive behavior is due to other familial influences. Perhaps children who are permitted to watch violent programming are more likely to come from violent or abusive families, which could also lead to more aggressive behavior.