Download
1 / 23
230 likes | 354 Vues
EFFECTIVE SHARE MARKET INVESTMENT STRATEGY. 3 Step Process - Selling Equity. Step 1: UNDERSTAND why ONE should invest in Equity rather than FD’s, Gold, etc? Step 2: Remove the fears of Equity Investment. Step 1: Why Equity?. You still have to convince people to buy equity….

E N D
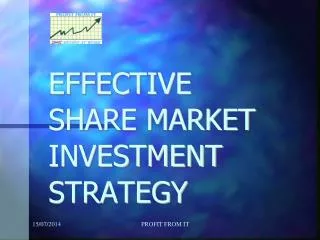
EFFECTIVE SHARE MARKET INVESTMENT STRATEGY PROFIT FROM IT
PROFIT FROM IT 3 Step Process - Selling Equity Step 1: UNDERSTAND why ONE should invest in Equity rather than FD’s, Gold, etc? Step 2: Remove the fears of Equity Investment.
PROFIT FROM IT Step 1: Why Equity? You still have to convince people to buy equity…. Current Share of Household Savings Individual Investor: Savings Profile Bank FDs 42.90% Small Savings 17.70% Cash 10.10% Equity & Contractual Debentures 1.40% Savings* 27.90% *Contractual saving comprises Life Insurance, Provident and Pension Funds Low penetration of equity in household savings Source: CSO - 2003 - 2004
PROFIT FROM IT Step 1: Why Equity? Performance of Various Asset Classes (Cumulative annualised returns 1980-2004) 15.6% 10.3% 8.9% 6.7% 5.7% 3.55% -1.1% Inflation Gold Bank FDs BSE Sensex Growth Real Growth Equities outperform other asset classes over the long term
PROFIT FROM IT Step 1: Why Equity? Note the 5% difference in return between equity and FD’s in the previous slide… What does it actually mean for the customer?
PROFIT FROM IT Step 1: Why Equity? Monthly Investment for 21 years Debt Instrument Equity Scenario A Equity Scenario B Monthly investment Rs. 5,000 Rs. 5,000 Rs. 5,000 Annualised return 10% 15% 20% Final corpus Rs. 43 lakh Rs. 89 lakh Rs. 1.9 crore Note that a 5% differential more than doubles your corpus over 21 years
PROFIT FROM IT Step 1: Why Equity? The reality today: FD rates are around 7-7.5% today. Equities gave a return of around 17% in the last 25 years, when average GDP was 4-4.5%. Equities may grow at 25-30% riding on strong GDP growth projections of 8-10%. If a 5% difference in growth doubles the final corpus, imagine the difference that investments in equity can make.
PROFIT FROM IT Step 1: Why Equity? Your saving capacity is limited (Income less Expenses). Your savings must work more for you, because you cannot increase your savings significantly. See the impact in the next slide that higher returns can have on your savings requirement.
PROFIT FROM IT Step 1: Why Equity? Look at the differences in amount of savings required to reach a target corpus of 1 crore…..
PROFIT FROM IT Step 1: Why Equity? So, equities provide you with the opportunity to provide the big BANG your investments need, through the possibility of better returns. As a good investor, we would be benefited if we come into equity with a 15-20 year investment horizon.
PROFIT FROM IT Step 2: Remove the Fear Investors are afraid to invest in equity for 3 main reasons: Downside risk (fear of loss) Risk of market timing (don’t want to enter at high levels) No guarantees…..
PROFIT FROM IT Step 2: Remove the Fear Investors are afraid to invest in equity for 3 main reasons: Downside risk (fear of loss) Risk of market timing (don’t want to enter at high levels) No guarantees…..
PROFIT FROM IT Step 2: Remove the Fear (Risk of Loss) Risk With time risk REDUCES Time EQUITIES ARE GENERALLY PERCEIVED AS HIGH RISK HIGH POTENTIAL RETURN INSTRUMENTS, BUT WITH MORE TIME SPENT IN THE MARKET, THE RISK ASSOCIATED WITH EQUITY INVESTMENTS REDUCES. THE NEXT SLIDE WILL SHOW YOU HOW….
PROFIT FROM IT Step 2: Remove the Fear (Risk of Loss) ACTUAL BSE SENSEX PERFORMANCE FOR BUY-HOLD-SELL FOR A PERIOD OF 1, 5 AND 10 YEARS (data 1980-2001). AS YOU CAN SEE, WITH INCREASE IN TIME SPENT IN INVESTENT IN EQUITY, THE RISK OF LOSS REDUCES (YOU NEVER LOST MONEY IN A 10 YEAR PERIOD). SO LONG TERM INVETMENT IN EQUITY IS A SAFE OPTION.
PROFIT FROM IT Step 2: Remove the Fear (Risk of Market Timing) 16.90% 16.02% 15.07% Fixed investment athighest sensex valueevery year Fixed investment atlowest sensex valueevery year Fixed investment on 1st day of every month Returns shown for 3 investors, each making same investment in the BSE Sensex every year (25 year history)….. Market timing does not matter over the long term…..every time is the right time to enter the equity market, if you coming into a systematic investment plan Data source: ICRA MFIE
PROFIT FROM IT Step 3: The Power of SIP A Systematic Investment Plan is a plan where you invest a fixed amount every time at predetermined dates (monthly/quarterly/half-yearly/annual) in a particular investment option.
PROFIT FROM IT Step 3: The Power of SIP Lets see actual BSE Sensex performance on SIP….. Actual Returns in a SIP on BSE Sensex over a 25 year period shows that the compounded annualised return was 19%.
PROFIT FROM IT Step 3: The Power of SIP The next slide will show you the returns earned by customers in SIP for 10 years in the equity market. We have given various scenarios….and you can see that the customer has always earned very good returns.
PROFIT FROM IT Step 3: The Power of SIP on BSE Sensex (10 year SIPs) Click on the Icon to access the data
PROFIT FROM IT Step 3: The Power of SIP on BSE Sensex (10 year SIPs) This data in the previous slide shows the power of investing in equities through a systematic investment plan…. You can ask the customer to start at any point and end 10 years later…. Historically, he would have made attractive returns in any scenario. The 10 year blocks will ride booms and busts and still has given the investor excellent returns. For example, if an investor started in 1993, he would have started just after the Harshad Mehta Scam…. If he started in 1990, he would have ended at 1999, and would have ridden the Harshad Mehta and the Ketan Parekh scams and still made a return of 23%. Now, how compelling is that statement????
PROFIT FROM IT Step 3: The Power of SIP So, start investing 10 years investment, irrespective of whether the market goes up or down Actually when the market goes down in the short term the SIP investor benefits because he is buying more units for the same investment.
PROFIT FROM IT Step 3: The Power of SIP The advantages of investing 10 year SIP’s are: You can invest when the markets are rising as well as when the markets are falling. You don’t have to play God and predict what is going to happen tomorrow while making a investment
Thank You!!! And All the Best. PROFIT FROM IT