Download
1 / 12
120 likes | 249 Vues
This guide focuses on the 6th-week project, requiring students to showcase components learned in earlier weeks. It outlines the essential sections for the formal lab presentation, emphasizing objectives, approach, results, and conclusions. Critical points include defining the studied system, explaining its use, and presenting theoretical background. Students are encouraged to illustrate concepts with diagrams while adhering to the instructor's guidance for content depth. The project includes graphical results with uncertainty bars for a comprehensive understanding of findings.

E N D
Title of your project Sec …. ID …. Name …. ID …. Name …. ID …. Name …. ID …. Name …. NOTE: This guide is only for the 6th week project, where I want to see some of the components that we learned from the first five weeks. Note that in formal presentation of your lab, some of the components here may be considered too details to be shown. Consult your lab instructor for the presentation of the lab in Part II. For the slides that should also be in your lab presentation in Part II too, I will mark it with ***.
Section 1: Objective • *** General Introduction • *** Motivation • *** Objectives
*** General Introduction • What is the system you study? • Where can we find it? • What is it for (its use)?
*** Motivation • Why do you want to study the specific problem/question in the objectives? What will be the use of the results of your study?
*** Objectives • Three-column objective • Statement • Functional form • Format of graphical plot
Section 2: Approach (Each bullet may take one or more slides) • Theoretical background (if any) • *** Define your system with a diagram (This may be in Section 1: Introduction) • *** Principle of your experiment (illustrated with a diagram, can be the same diagram as in 2) • *** Experimental Setup (illustrated with a diagram, can be the same diagram as in 3) • In presenting, describe how your setup works from the diagram, NOT a list of equipments/instruments. • *** Experimental Conditions (values of p and c) • Example of DRD (no need to show all, just one is good enough) • *** What quantities do you measure and where do you measure them? (Illustrated with the diagram in 4-Experimental Setup)
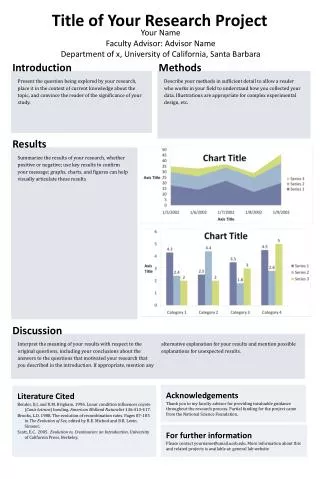
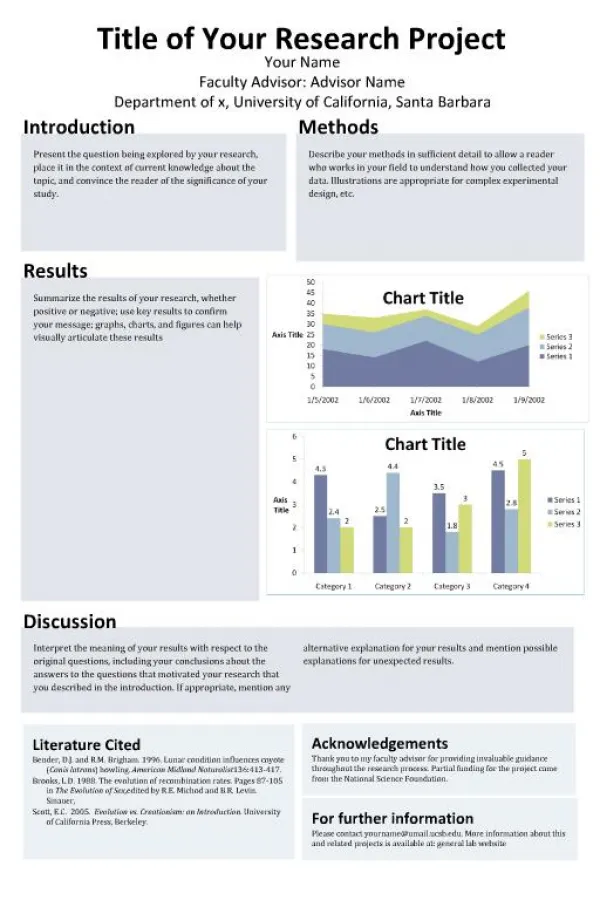
Section 3: Results and Conclusions • *** (Graphical) Results • Discussions (if any is required) • *** Conclusions
*** Conclusions • We find that … • We find that … • We find that …


![Title Slide [Type the title of your project]](https://cdn2.slideserve.com/4464484/title-slide-type-the-title-of-your-project-dt.jpg)