Download
1 / 13
130 likes | 151 Vues
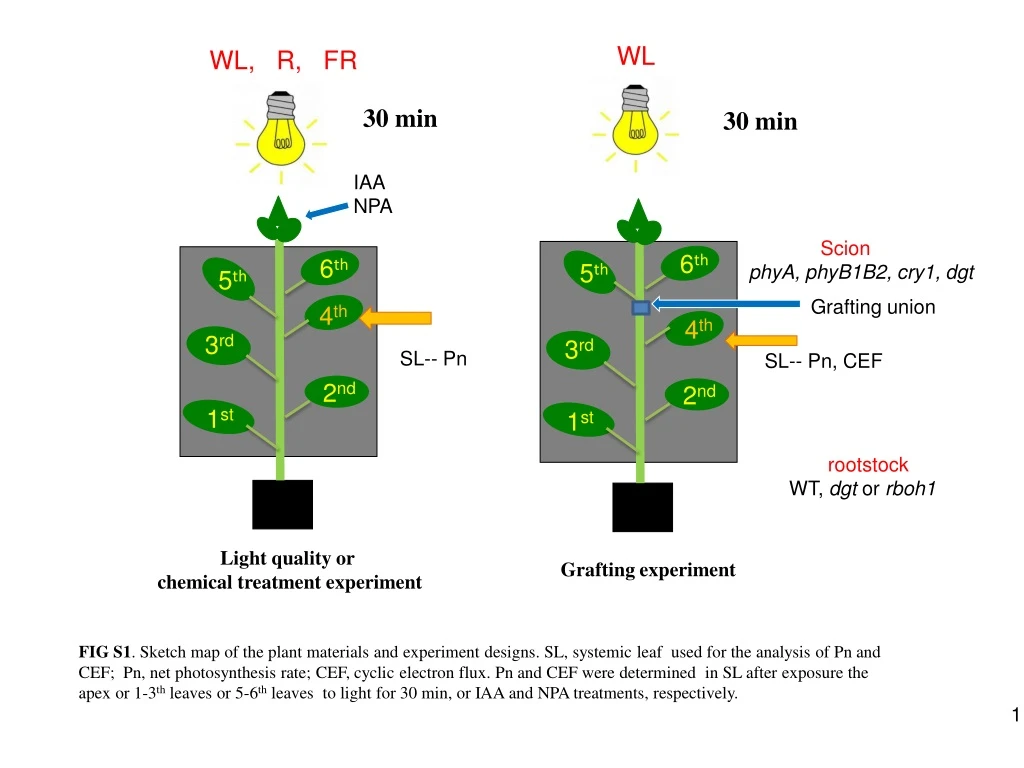
WL. WL, R, FR. 30 min. 30 min. IAA NPA. Scion phyA , phyB1B2, cry1, dgt. 6 th. 6 th. 5 th. 5 th. Grafting union. 4 th. 4 th. 3 rd. 3 rd. SL-- Pn. SL-- Pn , CEF. 2 nd. 2 nd. 1 st. 1 st. rootstock WT, dgt or rboh1. Dark. Grafting experiment.

E N D
WL WL, R, FR 30 min 30 min IAA NPA Scion phyA, phyB1B2, cry1, dgt 6th 6th 5th 5th Grafting union 4th 4th 3rd 3rd SL-- Pn SL-- Pn, CEF 2nd 2nd 1st 1st rootstock WT, dgt or rboh1 Dark Grafting experiment Light quality or chemical treatment experiment FIG S1. Sketch map of the plant materials and experiment designs. SL, systemic leaf used for the analysis of Pn and CEF; Pn, net photosynthesis rate; CEF, cyclic electron flux. Pn and CEF were determined in SL after exposure the apex or 1-3th leaves or 5-6th leaves to light for 30 min, or IAA and NPA treatments, respectively. 1
FIG S2 Effects of pre-illumination at different white light intensity on the induction of photosynthesis in the systemic leaves. Apex was pre-illuminated with white light (L) at 50, 150 and 300 µmolm-2s-1 for 30 min before CO2 assimilation was analyzed in the 4th leaves. Net photosynthesis rate was expressed as percentage of the maximum Pn. Plants without pre-illumination (dark, D) were used as control. The values were obtained from four plants, and the values are presented as means ± SD. Different letters indicate significant differences at P < 0.05 according to Tukey's test.
FIG S3 Effects of pre-illumination on the induction of photosynthesis in plants with cry1 as scion. Apex was pre-illuminated with white light (L) at 300 µmolm-2s-1 for 30 min before CO2 assimilation was analyzed in the 4th leaves. Net photosynthesis rate was expressed as percentage of the maximum Pn. Plants without pre-illumination (dark, D) were used as control. The values were obtained from four plants, and the values are presented as means ± SD. Different letters indicate significant differences at P < 0.05 according to Tukey's test.
FIG S4 The influence of systemic light signaling on the time required to reach 50% or 90% of the maximum net photosynthetic rate (T50 or T90) in photosynthetic induction. Apex was pre-illuminated with white light (L) at 300 µmol m-2s-1 for 30 min before CO2 assimilation was analyzed in the 4th leaves. Net photosynthesis rate was expressed as percentage of the maximum Pn. Plants without pre-illumination (dark, D) were used as control. The values were obtained from four plants, and the values are presented as means ± SD. Different letters indicate significant differences at P < 0.05 according to Tukey's test.
FIG S5 Relative transcript of PIN1 in the 4th leaf as influenced by the pre-illumination. Apex was pre-illuminated with white light (L) at 300 µmolm-2 s-1 for 30 min before samples were taken. Plants without pre-illumination (dark, D) were used as control. The values were obtained from four plants, and the values are presented as means ± SD. Different letters indicate significant differences at P < 0.05 according to Tukey's test.
FIG S6 Effects of application of NPA on the induction of photosynthesis . Apex was pre-illuminated with white light (L) at 300 µmol m-2s-1 for 30 min before CO2 assimilation was analyzed in the 4th leaves. NPA were applied 30 min before the pre-illumination. Net photosynthesis rate was expressed as percentage of the maximum Pn. Plants without pre-illumination (dark, D) were used as control. The values were obtained from four plants, and the values are presented as means ± SD. Different letters indicate significant differences at P < 0.05 according to Tukey's test.
C D FIG S7 Effects of pre-illumination on the induction of photosynthesis in the 4th leaf in grafting plants with dgtas rootstock. Apex was pre-illuminated with white light (L) at 300 µmol m-2 s-1 for 30 min before CO2 assimilation was analyzed in the 4th leaves. Net photosynthesis rate was expressed as percentage of the maximum Pn. Plants without pre-illumination (dark, D) were used as control. The values were obtained from four plants, and the values are presented as means ± SD. Different letters indicate significant differences at P < 0.05 according to Tukey's test
FIG S8 Relative transcript of RBOH1 in the scion leaves and rootstock leaves in grafted plants used for the experiment (n=12). Up, the 5th leaf, Down, the 4th leaf.
A B C Fig S9. Time course of the net photosynthetic rate (Pn) and cyclic electron flux (CEF) in the 4th leaf as influenced by the suppressed transcript of RBOH1 in grafted plants. A, Time course of the net photosynthetic rate (Pn) during photosynthetic in the 4thleaf. Net photosynthesis rate was expressed as percentage of the maximum Pn. B and C, cyclic electron flux (CEF)in the 4thleaf. D, dark control. L, top lighting for 30 min with WL before the measurement of CO2 assimilation. The values were obtained from four plants, and the values are presented as means ± SD. Different letters indicate significant differences at P < 0.05 according to Tukey's test.
FIG S10 Cyclic electron flux and relative transcript of ORR in VIGS plants used for the experiment. The 4th leaf was used for the analysis.
Fig S11. CO2 assimilation rate for WT and phyB plants. CO2concentration, air humidity, PPFD and leaf temperature were maintained at 400μmol mol−1, 60%, 300μmol m-2s-1, and 25oC, respectively.
Supplementary Table 1. List of primer sequences used for qRT-PCR analysis.
Supplementary Table 2. Parameters used for detection of IAA and related compound by LC-MS/MS. 1collision-induced dissociation; 2collision energy; IS, internal standard.