Download
1 / 33
330 likes | 346 Vues
This report examines trends in End-Stage Renal Disease (ESRD) incident rates, cardiovascular mortality rates, and preventive health measures in dialysis patients. The data includes rates per million population, adjusted for age, gender, and race/ethnicity.

E N D
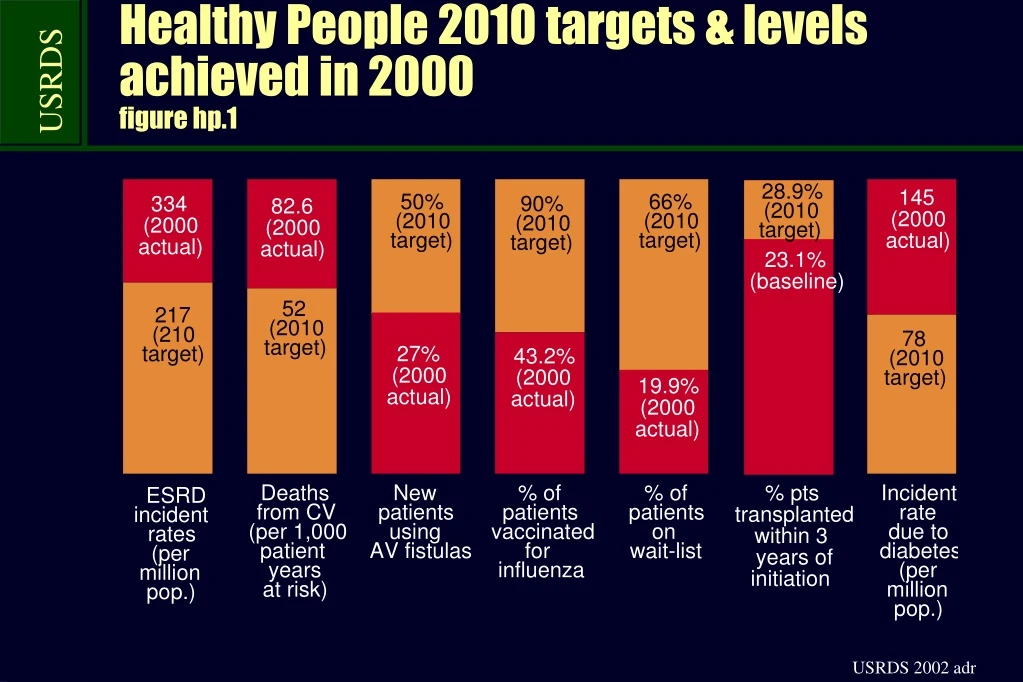
Healthy People 2010 targets & levels achieved in 2000figure hp.1
Trends in ESRD incident ratesfigure hp.2, incident ESRD patients, adjusted for age, gender, & race
ESRD incident rates, by year table hp.a, rate per million population, incident ESRD patients
Trends in ESRD incident ratesfigure hp.3, incident ESRD patients, by age & race/ethnicity
Trends in ESRD incident rates, by primary diagnosis, & in rates of diabetes in the general population figure hp.4, adjusted for age, gender, & race
Trends in cardiovascular mortality rates among ESRD patients figure hp.5, period prevalent patients
Cardiovascular mortality rates in ESRD patients, by modality table hp.b, deaths per 1,000 patient years at risk, period prevalent ESRD patients
Trends in all-cause & cardiovascular mortality rates in ESRD patientsfigure hp.6, period prevalent ESRD patients, by race/ethnicity illi illi lla lla
Trends in rates of cardiovascular disease in ESRD patientsfigure hp.7, deaths per 1,000 patient years, period prevalent ESRD patients illi illi lla lla
Trends in arteriovenous fistula use in hemodialysis patients, by data source figure hp.8, incident hemodialysis patients, 1998-1999 combined Symbols D% from previous year illi illi lla lla
Arteriovenous fistula use in incident hemodialysis patients, by data sourcetable hp.c, percent of patients illi illi lla lla
Trends in arteriovenous fistula use in prevalent hemodialysis patients, by age & race/ethnicityfigure hp.9, period prevalent hemodialysis patients illi illi lla lla
Trends in access fistula use in prevalent hemodialysis pts, by gender & diabetic statusfigure hp.10, period prevalent hemodialysis patients illi illi lla lla
Trends in the percent of ESRD patients receiving influenza vaccinationsfigure hp.11 illi illi lla lla
Percent of ESRD patients receiving influenza & pneumonia vaccinations, by yeartable hp.d, percent of patients vaccinated illi illi lla lla
Trends in the percent of ESRD patients receiving influenza vaccinations, by age & race/ethnicity figure hp.12 illi illi lla lla
Pneumococcal pneumonia vaccinations in ESRD patients, by age & race/ethnicityfigure hp.13, for 1995-1996 period illi illi lla lla
Trends in the percent of dialysis patients on the transplant waiting listfigure hp.14, period prevalent hemodialysis patients illi illi lla lla
Percent of patients on the transplant waiting list, by yeartable hp.e illi illi lla lla
Dialysis pts on the transplant waiting list, by age, gender, race/ethnicity, & primary diagnosistable hp.15 illi illi lla lla
Dialysis pts on the transplant waiting list, by age, gender, race/ethnicity, & primary diagnosistable hp.15 (cont.) illi illi lla lla
Percent of dialysis patients receiving a transplant within 3 years of initiation of therapyfigure hp.16 illi illi lla lla
Percent of dialysis patients receiving a transplant within 3 years of initiation, by yeartable hp.f illi illi lla lla
Dialysis patients receiving a tx within 3 years, by age, gender, race/ethnicity, & diagnosisfigure hp.17 illi illi lla lla
Dialysis patients receiving a tx within 3 years, by age, gender, race/ethnicity, & diagnosisfigure hp.17 (cont.) illi illi lla lla
Trends in incident rates of ESRD due to diabetesfigure hp.18, incident ESRD patients, adjusted for age, gender, & race Bars: Rat per million population illi illi lla lla
Incident rates of ESRD due to diabetes, by modality & yeartable hp.g, rate per million population, incident ESRD patients illi illi lla lla
Trends in incident rates of ESRD due to diabetes, by agefigure hp.19, incident ESRD patients, adjusted for gender & race illi illi lla lla
Trends in incident rates of ESRD due to diabetes, by race/ethnicityfigure hp.20, incident ESRD patients, adjusted for age & gender illi illi lla lla
Percent of diabetic patients receiving all 3 diabetic preventive health tests, by data sourcefigure hp.21 General Medicare Pre-ESRD illi illi lla lla
Percent of diabetic patients receiving preventive health tests, by test typetable hp.h, 1997-1999 illi illi lla lla
Diabetics receiving all 3 preventive health tests, by pt population, age, & race/ethnicityfigure hp.22 illi illi lla lla
Diabetics receiving all 3 preventive health tests, by pt population, age, & race/ethnicityfigure hp.22 (cont.) illi illi lla lla