Download
1 / 1
10 likes | 150 Vues
-90.8 C. 0.0 C. 49.9 C. Introduction:

E N D
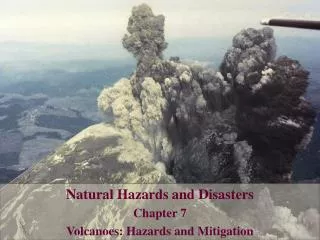
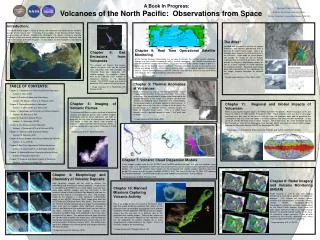
-90.8 C 0.0 C 49.9 C Introduction: The North Pacific region is home to nearly 100 volcanoes that comprise the northern portion of the “ring of fire”. It includes the Cascades of the Western United States, several areas of Alaska, including the Wrangells, the Alaska Peninsula and the Aleutians, which are mainly volcanic islands, and also the Kamchatka Peninsula and the Kurile Islands of Eastern Russian . In this region, we find examples of all volcano types and eruption styles. The Atlas: Included with the book is an atlas of various volcanoes and volcano phenomena with a focus on the North Pacific region. Here is an example page showing Veniaminof volcano in the Aleutians. Each page (or set of pages) will include an image or set of images showing either a volcano or an event. We will provide the image(s) identification number as well as a small map with an arrow indicating the volcano’s location. Along with each image there will a description of the significance of the image, imaging technique or volcanic event. * Sample page courtesy of Ken Dean, AVO. Chapter 9: Real Time Operational Satellite Monitoring At the Alaska Volcano Observatory, we are able to monitor the northern pacific volcanoes through real time satellite imagery as well as seismic monitoring. For satellite monitoring, we use the 9 different sectors shown above. These are “cut out” of the satellite images to give us a better view of the desired volcano locations. Thermal anomalies as well as ash plumes and clouds are looked for. This information is used to inform various federal agencies of volcanic activity. One of these agencies is the FAA, who can then alert any aircraft to steer clear of an ash cloud, as ash is highly dangerous to aircraft engines. * Image courtesy of AVO Chapter 11: Regional and Global Impacts of Volcanism When a catastrophic eruption occurs, the effects are often felt globally. Recent examples of this are Mount St. Helens in 1980 and Mt. Pinatubo in 1992. These eruptions sent ash over a very large localized area, but some of the gasses and ash from the eruptions were able to penetrate the stratosphere and thus enter into global circulation patterns and effect weather worldwide. In the photo we see Mt. Pinatubo after its dome collapse. The image shows S02 levels worldwide due to Mt. Pinatubo as seen by the Microwave Limb Sounder (MLS) instrument on board NASA's Upper Atmosphere Research Satellite (UARS) on September 23, 1991. * Images courtesy of California State University, Fullerton and Suffolk Community College Chapter 6: Gas Emissions from Volcanoes This chapter will discuss the various species of gasses that can be emitted from volcanoes and also methods for retrieving these gas signatures from satellite imagery. An example is shown here of the February 2001 eruption of Cleveland Volcano in the Aleutian Islands. This MODIS image was used to determine SO2 amounts in the ash cloud. * Image courtesy of V. Realmuto, I.M. Watson of JPL. Chapter 8: Radar Imagery and Volcano Monitoring (INSAR) Rader imagery is used in long term volcano monitoring to track dome growth and other such changes. This chapter will discuss various methods and interpretations using radar imagery, notably INSAR. Topography-removed interferograms (observed, synthetic, and residual) for the Mount Peulik volcano. Each fringe (full color cycle) represents 2.83 cm of range change between the ground and the satellite. In this case, six concentric fringes represent 17 cm of uplift centered on the volcano’s southwest flank. Areas of loss of radar coherence are uncolored. * Image courtesy of Z. Lu (MTU). Chapter 7: Volcanic Cloud Dispersion Models In this chapter, models such as Puff, HYSPLIT and CanERM will be discussed. In a real time situation, these models allow us to extrapolate to where ash may travel and thus can be used to inform agencies of potential danger. In a research situation, these models can be compared with satellite imagery from the same time period. The images are (left to right) CanERM, HYSPLIT, Puff. The time is 03:00 Feb. 21, 2001 UTC following the Cleveland eruption. CanERM and Hysplit are color-coded by concentration, Puff by altitude. * Image courtesy of Rorik Peterson, AVO. Chapter 5: Imaging of Volcanic Plumes This chapter will discuss various methods of detecting volcanic ash cloud or plumes from satellite imagery. Techniques such as band subtraction can help us bring out the ash from the background cloud cover. This image is from the March 1986 eruption of Augustine volcano located near Anchorage, Alaska. It is a color composite using Landsat TM bands 3, 2 and 1. * Image courtesy of D. Schneider, AVO. Chapter 4: Morphology and Chemistry of Volcanic Deposits High resolution imagery will be used to discuss the morphology and chemistry of volcanic deposits. Imagery such as LandSAT and ASTER have a much higher resolution than many other satellite imagery and they are useful in the research setting to look at different flow deposits and how the shape of the volcano is changing over time. The example image for this chapter is a color composite 3-dimensional drape of the ASTER 15m/pixel VNIR image data over the ASTER-derived DEM (both from 1 May 2000). Over these are the TIR 90m thermal anomaly data arranged in chronological order from April to October 2000. Significant changes in intensity and location of the anomalous pixels can be seen on the dome. Following the large eruption in March 2000 numerous hot debris flows were emplaced in the small valley southeast of the dome. This pattern occurred again following the October 2000 eruption (not shown here) and included two distinct flow emplacement/cooling events in two weeks at the end of December 2000/early January, 2001. This pattern likely represents endogenic lava dome growth and collapse following the larger eruptions. * Image courtesy of M. Ramsey (UPitt) Chapter 3: Thermal Anomalies at Volcanoes Much of what we can see of volcanic activity from satellite images come in the form of “thermal anomalies”. These show up as pixels that are elevated in temperature compared to the background pixels in the image. This chapter will deal with methods of detecting these anomalies and interpretations. The example shown is of Okmok Volcano in the Aleutians. In the larger image you can see a cluster of white pixels, the smaller image is a zoomed version, showing roughly 22 pixels of elevated temperatures. This is a rather large anomaly and it is possible to pick out even 1 “hot” pixel from an image. * Image courtesy of Ken Dean, AVO. Chapter 10: Manned Missions Capturing Volcanic Activity This is an image of Simushir Island in the Kuriles taken from the space shuttle by astronaut Tom Jones. In this image we note a picturesque crescent bay and 3 different volcanoes: Prevo, Zavaritzki and Goryashchaya Sopka. Images like this can give us a different view of the volcanoes than satellite images. They can be used to see if there are new material deposits on the volcanoes and can be compared to satellite imagery for a more comprehensive understanding of the region. Inset is a true color image of the crescent bay. * Image courtesy of P. Mouginis-Mark, UH. A Book In Progress: Springer Praxis Publisher Editors: Ken Dean and Jon Dehn Poster Graphics: Laura Bickmeier (UAF/GI) Volcanoes of the North Pacific: Observations from Space • TABLE OF CONTENTS: • Chapter 1: Complexities of Observing Remote Volcanoes • Author: K. Dean (UAF) • Chapter 2: Satellite Systems and Interactions • Authors : M. Watson (MTU) & A. Prakash (UAF) • Chapter 3: Thermal Anomalies at Volcanoes • Authors : J. Dehn (UAF) & A. Harris (UH) • Chapter 4: Morphology and Chemistry of Volcanic Deposits • Authors : M. Ramsey (U Pitt) • Chapter 5: Imaging of Volcanic Plumes • Authors : D. Schneider (USGS) • Chapter 6: Gas Emissions from Volcanoes • Authors: V. Realmuto (JPL) & M. Watson (MTU) • Chapter 7: Volcanic Cloud Dispersion Models • Authors: R. Peterson (UAF) • Chapter 8: Radar Imagery and Volcano Monitoring (INSAR) • Authors: Z. Lu (USGS) • Chapter 9: Real Time Operational Satellite Monitoring • Authors : K. Dean (UAF) & D. Schneider (USGS) • Chapter 10: Manned Missions Capturing Volcanic Activity • Authors: P. Mouginis-Mark (UH) • Chapter 11: Regional and Global Impacts of Volcanism • Authors: L. Flynn & R. Wright (UH)