Download
1 / 16
160 likes | 317 Vues
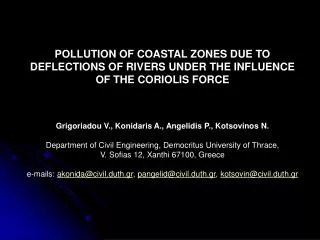
POLLUTION OF COASTAL ZONES DUE TO DEFLECTIONS OF RIVERS UNDER THE INFLUENCE OF THE CORIOLIS FORCE Grigoriadou V., Konidaris A., Angelidis P., Kotsovinos N. Department of Civil Engineering, Democritus University of Thrace, V. Sofias 12, Xanthi 67100, Greece

E N D
POLLUTION OF COASTAL ZONES DUE TO DEFLECTIONS OF RIVERS UNDER THE INFLUENCE OF THE CORIOLIS FORCE Grigoriadou V., Konidaris A., Angelidis P., Kotsovinos N. Department of Civil Engineering, Democritus University of Thrace, V. Sofias 12, Xanthi 67100, Greece e-mails: akonida@civil.duth.gr, pangelid@civil.duth.gr, kotsovin@civil.duth.gr
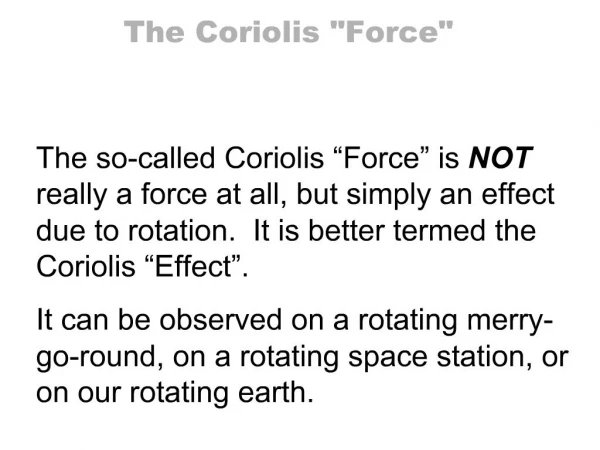
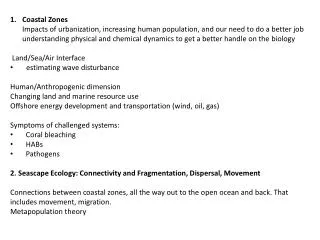
Surface plume trajectory of river discharging into sea • Initial momentumat the estuary • Buoyancy forcesdue to the density difference of the sea ambient • Surface shear stressdue to the winds • Geomorphologyof the seabed • Coriolis forcedue to the earth’s rotation
Satellite image of North Aegean and Propontis (June 2003) (source: http//modis.gsfc.nasa.gov/)
Observation platform cameras 5.2m motor PC flow meter 1.0m Outflow pipe 15cm Angular velocity control sensor
Usage of potassium permanganate (red colour) Identical density for outflow & ambient water Rotation of the basin for some hours before the experiment, for the ambient water to acquire rigid body form 30cm
26 experiments Volume rate Q: 0.48 – 1.76 lt/min Rotation period Τ: 30 – 90 s Froude number: : 0.33 – 1.19 Rossby number: : 0.017 – 0.214 INERTIAL FORCES GRAVITY FORCES INERTIAL FORCES CORIOLIS FORCES
t/T=5.67 ymax
y x Behavior at the initial phase of the spread Dimensionless parametric equation of the trajectory (clotoid curve) : dimensionless distance along the trajectory : characteristic length Jr: momentum flux at the orifice α: 0.01 - 0.095 Valid for deep ambient (h/L > 0.2)
Q = 0.96 lt/min T = 60 sec Ltheor. = 0.44 m Fo = 0.65 Ro = 0.08 Comparison of an experimental trajectory at the initial phase of spread with the theoretical clotoidcurve fromSavage & Sobey.
t/T=5.67 ymax
Fo < 1 Fo > 1 Correlation of the dimensionless maximum spread width and theFroude number
using graph APPLICATION: calculation of the maximum spread width for flooddischarge of Evros river Q = 3000 m3/s averageestuary depth: 4m Uo = 1.25 m/s estuary width: 600m 41o north parallelΤ=37 hr natural river α=0.01 L = 11640 m YΑ = 0.8L = 9300 m Fo = 0.2 Ymax/YA = 1.3 Ymax = 12000 m
CONCLUTIONS • The influence of the earth’s rotation (Coriolis force) on the spread of the large scale environmental flow was studied • A series of experiments with horizontal outflow in rotating ambient was performed • Deflection to the right of the outflow axes was observed • The theory of Savage & Sobey that at the initial phase the trajectory of the front follows the clothoid curve was validated • The existence of a maximum spread width, where the discharge water is restricted and remains for a long time was detected • A method for the calculation of the maximum spread width was suggested, as a function of the initial conditions: • outflow velocity • outflow momentum flux • angular velocity • ambient depth