Download
1 / 15
160 likes | 322 Vues
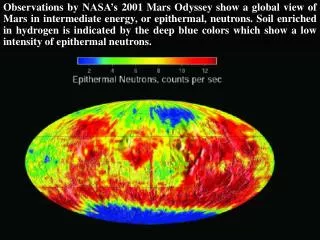
CO 2 deposit at polar regions. Comparison between HEND (Mars Odyssey) and MOLA (MGS). Litvak M.L 1) , Mitrofanov I.G. 1) , Zuber M.T. 2) Smith D.E. 3) , Kozyrev A . S. 1) , Sanin A.B. 1) , Tretyakov V.I. 1) , Boynton, W . 4) ,Hamara D. 4) , Shinohara C. 4)

E N D
CO2deposit at polar regions. Comparison between HEND (Mars Odyssey) and MOLA(MGS)
Litvak M.L1), Mitrofanov I.G.1), Zuber M.T.2) Smith D.E.3), Kozyrev A.S. 1), Sanin A.B.1), Tretyakov V.I.1) , Boynton, W. 4),Hamara D.4), Shinohara C.4) Saunders R.S.5), Drake D.6) 1) Space Research Institute, Moscow, Russia 2)Massachusetts Institute of Technology, Cambridge,USA 3)NASA/Goddard Space Flight Center, USA 4) University of Arizona, Tucson, USA 5) JPL, Pasadena, USA 6) LANL, USA
OBSERVATIONS North South Ls=3300 - 3600 Ls=300 - 600 Ls=900 - 1200 North Summer
North hemisphere →sublimation of CO2 frost Latitude belts: 85N-90N → 80N-85N → 75N-80N → 70N-75N → 65N-70N → 60N-65N → Normalized neutron flux Ls, degree
South hemisphere →accumulation of CO2 frost Latitude belts: 85S-90S → 80S-85S → 75S-80S → 70S-75S → 65S-70S → 60S-65S → Normalized neutron flux Ls, degree
MULTI LAYER MODEL 1 Atmosphere thickness: 5-25 g/cm2 1 Atmosphere thickness: 5-25 g/cm2 2 Seasonal CO2 frost : variable thickness 2 Seasonal CO2 frost : variable thickness 3 Upper dry layer: 1-3% wt H2O; variable thickness 3 Upper dry layer: 1-3% wt H2O; variable thickness 4 Bottom infinite ice layer: >30% wt H2O
COMPARISON BETWEEN HEND AND MOLA • North: The comparison between HEND and MOLA has been done for the same Ls in different latitude belts. • There is good agreement between HEND vs. MOLA observations and model curves calculated for regolith model with 75% wt H2O in bottom layer. • 80N-85N: 10 g/cm2 depth of ice layer. • 75N-80N: 40 g/cm2 depth of ice layer. HEND data MOLA data
Model: Upper layer thickness estimations North hemisphere South hemisphere
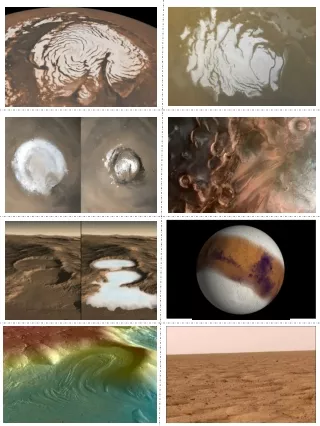
CO2 frost at different seasons: Ls=345o North hemisphere South hemisphere No CO2 frost
CO2 frost at different seasons: Ls=15o North hemisphere South hemisphere
CO2 frost at different seasons: Ls=40o North hemisphere South hemisphere
CO2 frost at different seasons: Ls=70o North hemisphere South hemisphere
CO2 frost at different seasons: Ls=95o North hemisphere South hemisphere
CO2 frost at different seasons: Ls=125o North hemisphere South hemisphere No CO2 frost
CONCLUSIONS • Mars seasonal changes are distinctly seen in HEND data. • There is good correlation between HEND (Mars Odyssey) data and MOLA (MGS) measurements of CO2 frost at different north latitudes. • Comparison HEND and MOLA data shows that visible effects may be easily explained based on two-layers model of regolith. • The model estimation of CO2 frost thickness shows that North and South differs each other. CO2 frost on South is thinner at near pole latitudes and demonstrate more irregular behavior then on North.