Life history and longevity
470 likes | 970 Vues
Life history and longevity. Population ecology Life history evolution Reproductive value Longevity and senescence. Discussion Readings. Kirkwood, T.B.L. and Austad, S.N. 2000 Why do we age? Nature 408:233-238.

Life history and longevity
E N D
Presentation Transcript
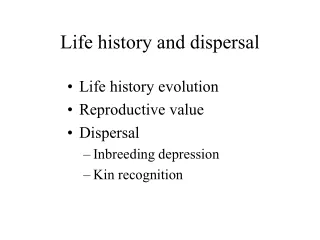
Life history and longevity • Population ecology • Life history evolution • Reproductive value • Longevity and senescence
Discussion Readings • Kirkwood, T.B.L. and Austad, S.N. 2000 Why do we age? Nature 408:233-238. • Perez-Campo, R., M. Lopez-Torres, S. Cadenas, C. Rojas and G. Barja 1998 The rate of free radical production as a determinant of the rate of aging: evidence from the comparative approach. Journal of Comparative Physiology B 168:149-158. • Brunet-Rossinni AK 2004. Reduced free-radical production and extreme longevity in the little brown bat (Myotis lucifugus) versus two non-flying mammals. Mechanisms of Aging and Development 125: 11-20.
Exponential population growth b = birth rate d = death rate r = intrinsic rate of population growth dN/dt = (b-d)N = rN “r-selected”
Logistic population growth Addition of a density dependent term results in logistic growth K = carrying capacity dN/dt = rN (K-N)/K “K-selected”
Age-specific population growth • Age-specific survivorship (lx) • Age specific reproduction (mx) • Net reproductive rate: Ro = S lxmx • Stable population: Ro = 1 • Growing population: Ro > 1 • Declining population: Ro < 1
The age-specific survival (lx) and fertility (mx) pattern specifies an organism’s life history pattern.
Life history trade-offsexpected with limited resources Lizards Birds Due to allocation of resources between maintenance and reproduction
Reproductive value • Age-specific expectation of offspring (how much is a female worth in terms of future offspring?) • Assuming a stable population (R = 1) • Vx = (St=xmt lt)/lx • the number of female offspring produced at this moment by females of age x or older / the number of females which are age x at this moment • Reproductive value peaks near puberty in human populations
Beetle Reproductive value curves Lizards Crustacea
Evolutionary theory of aging • The risk of extrinsic mortality should influence life span because the force of natural selection declines with age • Consequently, mutations with late-acting deleterious effects will not be eliminated (antagonistic pleiotropy) • Senescence should result and shorten life span in proportion to mortality risk • Expect that investing in early reproduction will detract from survival - the “disposable soma” idea
Bat Methuselahs Myotis brandti (38 yrs, 8 g) Myotis lucifugus (34 yrs, 7 g) Myotis blythii (33 yrs, 23 g) Plecotus auritus (30 yrs, 7 g) Pteropus Giganteus (31 yrs, 1 kg) Rhinolophus ferrumequinum (31 yrs, 24 g)
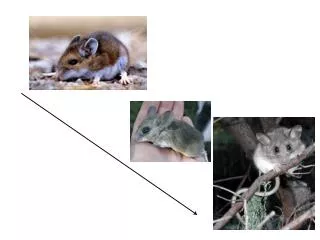
Aging studies and bats • Bats are long-lived because they save energy by going into torpor or hibernate (Bouliere 1958) • But, nonhibernating tropical bat species live as long as temperate species (Herreid 1964) • Furthermore, bats live longer than expected for their body size even after adjusting for metabolic differences (Jurgens and Prothero 1987) • And, marsupials, which have lower metabolic rates than bats, have much shorter life spans (Austad and Fischer 1991) • Flying mammals live longer than nonflying mammals (Holmes and Austad 1994)
Possible factors influencing extrinsic mortality risk in bats • Body size • Group size • Cave roosting • Diet • Hibernation (Latitude) • Reproductive rate
Longevity records for bats Data sources on longevity 56 from publications 8 from unpublished studies Distribution by family Pteropidae - 5 Emballonuridae - 1 Megadermatidae - 1 Rhinolophidae - 4 Noctilionidae - 1 Phyllostomidae - 8 Molossidae - 2 Vespertilionidae - 42 ANOVA (log long): F 7, 56 = 2.1, P = 0.064 Distribution by source Captive - 16 Field - 48 ANOVA: F 1, 62 = 1.3, P = 0.25
Phylogenetically independent contrastswere used to infer correlated evolution
Longevity and body mass in nonflying eutherian mammals (Austad & Fischer, 1991)
Longevity and body mass in bats Species means Independent contrasts F 1,40 = 7.3, P = 0.01 F 1,62 = 1.5, P = 0.23 Longevity (y) Change in longevity (log y) Body mass (g) Change in body mass (log g) Allometric relationship for 463 spp of nonflying placental mammals (Austad & Fischer 1991)
Colony size and longevity Longevity (y) Change in longevity (log y) F 1,60 = 1.5, P = 0.22 F 1,38 = 0.4, P = 0.52 Colony size Change in log colony size
Roosting habits and longevity F 2,61 = 4.6, P = 0.014 (a) (b) F 1,11 = 5.9, P = 0.033 Longevity (y) Change in longevity (log y) Cave roosting Change in cave roosting
Frugivory and longevity F 1,62 = 0.04, P = 0.84 F 1,2 = 0.1, P = 0.81 Longevity (y) Change in longevity (log y) Diet Change in fruit eating
Reproductive effort variation 1 pup/yr 1 pup/4-6 mos 2 pups/yr Rhinolophus darlingi Carollia perspicillata Nyctophilus gouldi
Reproductive effort and longevity (a) (b) Longevity (y) Change in longevity (log y) F 1,62 = 23.6, P = < 0.0001 F 1,40 = 19.4, P = < 0.0001 Reproductive rate Change in reproductive rate
Hibernation Twente et al. 1985
Hibernation and longevity F 1,60 = 13.7, P = 0.0005 F 1,5 = 10.3, P = 0.024 Longevity (y) Change in longevity (log y) Hibernation Change in hibernation
Latitude and longevity Longevity (y) Change in longevity (log y) F 1,62 = 14.6, P = 0.0003 F 1,41 = 8.4, P = 0.006 Species mid-range latitude Change in latitude
Multivariate analysis of longevity(independent contrasts) Source (controlled*) df F P Repro. rate (body mass) 1,56 16.9 0.0002 Hibernation (rep. rate) 1,56 14.3 0.013 Body mass (rep. rate) 1,56 5.4 0.025 Cave roosting (rep. rate) 2,56 5.2 0.043 *indicates the independent variable used to generate residual longevities for the contrast analyses, r2= 0.58
Conclusions • Bats live 3.5 times as long as other mammals of comparable size. • From an evolutionary perspective, extrinsic mortality risk could account for the effects of body size, cave roosting, reproductive rate and hibernation on longevity • From a physiological perspective, the effects of reproductive rate and hibernation on longevity are consistent with allocation of finite resources to the soma.
Implications • Caloric restriction is the only method for experimentally increasing lifespan in mammals • Calorie restricted (and hibernating!) rodents show • Decreased blood glucose • Decreased glycolytic enzyme activity • Increased gamma globulin levels • Increased antioxidant defenses • Hibernation could act to conserve resources much like caloric restriction
Proposed studies on big brown bats • Big brown bats are the most common NA bat • Big brown bats exhibit variation in litter size and hibernation across the species range
Aims - compare four sites • Estimate field metabolic rate, as a proxy for oxygen consumption, using doubly-labeled water and temperature sensitive radio telemetry • Compare seasonal survival at each site using transponder records • Quantify oxidative damage in collagen using flourescent microscopy • Determine if oxygen exposure influences the accumulation of mtDNA damage