Download
1 / 16
160 likes | 270 Vues
Oliver Ward (02) 8215 5097. Stock market trends . And how you spot them . Contents. Oliver Ward Market cycles Earnings P/E Stock screener. Oliver Ward.

E N D
Oliver Ward(02) 8215 5097 Stock market trends And how you spot them
Contents • Oliver Ward • Market cycles • Earnings • P/E • Stock screener
Oliver Ward Oliver is originally from Sweden where he studies electrical engineering at SSHL in Stockholm and he also served in the Royal Swedish Navy as a non-commissioned officer. Prior to his current role at Shaw Stockbroking as the Executive Portfolio manager Oliver worked for Macquarie Bank as a Financial Adviser, prior to this he lived and worked in New York for 15 years. Oliver received a Series 7 licence from the National Association of Securities Dealers in Washington DC, which enables Oliver to deal in Equities, Options, and Fixed Income etc. on behalf of individuals and Institutions, he was also awarded a Series 63 as an Options Principal. After St. Johns University, where Oliver gained a degree in finance; he worked for organisations such as Royal Bank of Canada and Farrell &Co. At RBC Oliver managed portfolios and provided advice to global corporations in Scandinavia; such as, Volvo, IKEA and Royal Bank of Sweden to name a few. Prior to RBC Oliver worked at M.S. Farrell & Co where he headed up the International Institutional Trading Desk. Moreover, Oliver has been key note speaker at ASX, Australian Investors Association, Australian Retirees Association, Australian Shareholders Association and Royal Automobile Club of Australia.
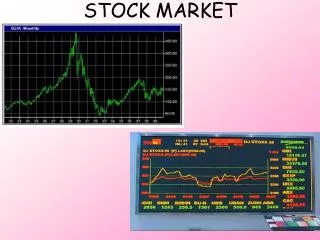
Secular markets The long-term view of the stock market reflects extended periods of surge and stall. These periods, known as secular bull markets and secular bear markets are not optical illusions; rather they are extended periods when market valuations (i.e. price/earnings ratios: P/Es) are either multiplying the effect of rising earnings or mitigating them. Secular bull market periods have always started when P/Es were below average, and secular bear markets have never ended when P/Es were above average.
Average yearly stock market return Average Rarely Happens: returns from the stock market over decade-long periods have rarely averaged the historic 7.75%; it has most often been well above average or well below average. There is no single factor that has as much impact on the variability of total returns form stock market over decade-long periods as the change in the level of valuation (P/E ratio)
Markets are more volatile than you may think In the past 100 years, the annual change in stocks--half of the time--is more than 16%, either up or down.
Earnings Over the last 3 decades earnings on the stock market has grown at an average rate of 7.4%. This is in line with the combined GDP and CPI rate.
Inflations effect on PE The change in PE for the stock market is directly related to the change in inflation; when prices move away from price stability PEs tend to decrees and when prices (inflation) moves towards price stability PEs tend to increase.
P/E change in percent yoy The latest stock market rally have seen a change in PE over 60%. Ergo, this rally was purely driven by PE change.
AAX AJL BLY CSL CVN IRE JBH MCC NVT OSH STO WPL WTF Market Cap over $20m PE less than 65 Revenue growth over 20% Profit growth over 20% EPS profit growth over 20% Rolling monthly Value over $20m ROE over 10% Stock screen
Current market status P/E remains ‘slightly undervalued’ toward the lower end of the normalized valuation range; the stock market remains positioned for nearer-term above average returns (assuming that the economy is not expected to enter a multi-year period of significant deflation or relatively high inflation). Notwithstanding the nearer-term trend, remains aware that typical market volatility makes it increasingly likely that the market will experience significant short-term swings. The ‘reported’ measure of EPS and P/E, reflecting the most recent four quarters, continues to become less distorted as earnings recover from the recession.
General Disclaimer This presentation is provided for general information purposes only and is not intended as an offer to enter into any transaction. This information contained in it is not necessarily complete and its accuracy can not be guaranteed. We have prepared this presentation without consideration of the investment objectives, financial situation or particular needs of any individual investor. Before a client makes an investment decision, a client should, with or without RBS Morgans' assistance, consider whether any advice contained in the presentation is appropriate in light of their particular investment needs, objectives and financial circumstances. It is unreasonable to rely on any recommendation without first having spoken to your adviser for a personal recommendation. The information contained in this presentation has been taken from sources believed to be reliable. RBS Morgans Limited does not represent that the information is accurate or complete and it should not be relied on as such. Any opinions expressed reflect RBS Morgans' judgment at this date and are subject to change. RBS Morgans and/or its affiliated companies may make markets in the securities discussed. Further RBS Morgans and/or its affiliated companies and/or their employees from time to time may hold shares, options, rights and/or warrants on any issue included in this presentation and may, as principal or agent, sell such securities. The Directors of RBS Morgans advise that they and persons associated with them may have an interest in the above securities and that they may earn brokerage, commissions, fees and other benefits and advantages, whether pecuniary or not and whether direct or indirect, in connection with the making of a recommendation or a dealing by a client in these securities, and which may reasonably be expected to be capable of having an influence in the making of any recommendation, and that some or all of our representatives may be remunerated wholly or partly by way of commission. The presentation is proprietary to RBS Morgans Limited and may not be disclosed to any third party or used for any other purpose without the prior written consent of RBS Morgans. RBS Morgans Limited (ABN 49 010 669 726 AFSL 235410) A Participant of ASX GroupPrincipal Office: Level 29, Riverside Centre, 123 Eagle Street, Brisbane QLD 4000