Download
1 / 12
120 likes | 150 Vues
Understand the difference between exploratory and inferential modeling, explore ANOVA, and delve into the basics of regression analysis. Learn about linear regression models, correlation versus regression, and statistical inference using least squares. Enhance your quantitative methods knowledge with practical insights and examples.

E N D
ANOVA continued and Intro to Regression I231B Quantitative Methods
Agenda • Exploration and Inference revisited • More ANOVA (anova_2factor.do) • Basics of Regression (regress.do)
It is "well known" to be "logically unsound and practically misleading" to make inference as if a model is known to be true when it has, in fact, been selected from the same data to be used for estimation purposes. - Chris Chatfield in "Model Uncertainty, Data Mining and Statistical Inference", Journal of the Royal Statistical Society, Series A, 158 (1995), 419-486 (p 421)
Never mix exploratory analysis with inferential modeling of the same variables in the same dataset. • Exploratory model building is when you hand-pick some variables of interest and keep adding/removing them until you find something that ‘works’. • Inferential models are specified in advance: there is an assumed model and you are testing whether it actually works with the current data.
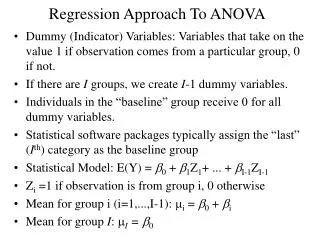
Basic Linear Regression (one iv and one dv)
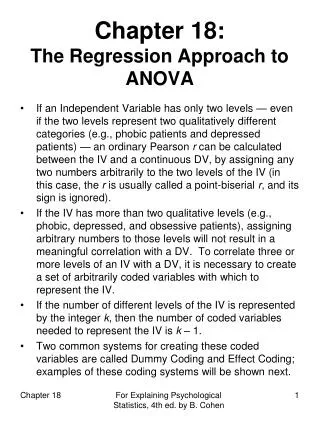
Regression versus Correlation • Correlation makes no assumption about one whether one variable is dependent on the other– only a measure of general association • Regression attempts to describe a dependent nature of one or more explanatory variables on a single dependent variable. Assumes one-way causal link between X and Y. • Thus, correlation is a measure of the strength of a relationship -1 to 1, while regression measures the exact nature of that relationship (e.g., the specific slope which is the change in Y given a change in X)
Basic Linear Model • Yi = b0 + b1xi + ei. • X (and X-axis) is our independent variable(s) • Y (and Y-axis) is our dependent variable • b0 is a constant (y-intercept) • b1 is the slope (change in Y given a one-unit change in X) • e is the error term (residuals)
Slope But...what happens if B is negative?
Statistical Inference Using Least Squares • We obtain a sample statistic, b, which estimates the population parameter. • We also have the standard error for b • Uses standard t-distribution with n-2 degrees of freedom for hypothesis testing. Yi = b0 + b1xi + ei.
Why Least Squares? • For any Y and X, there is one and only one line of best fit. The least squares regression equation minimizes the possible error between our observed values of Y and our predicted values of Y (often called y-hat).
Data points and Regression • http://www.math.csusb.edu/faculty/stanton/m262/regress/regress.html