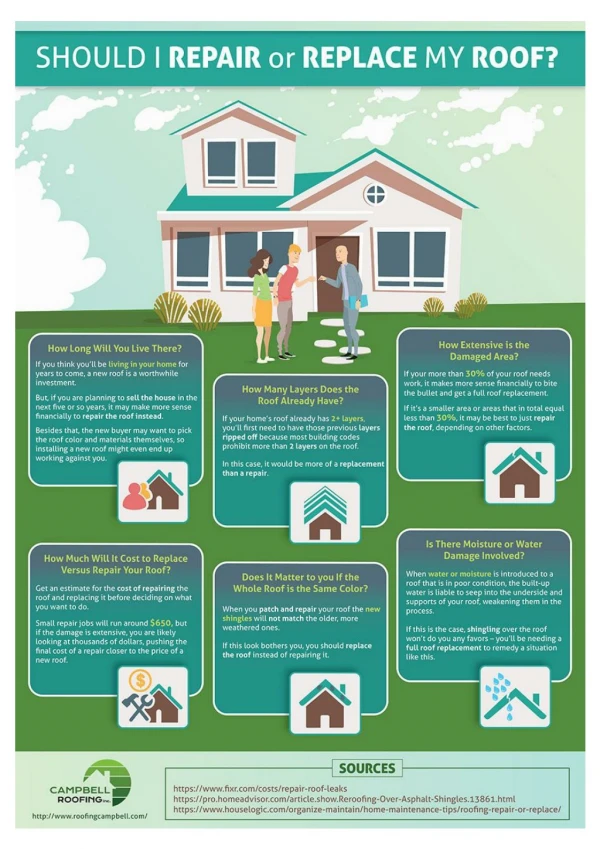

Repair vs. Replace
E N D
Presentation Transcript
Repair vs. Replace The Illusion
Many Years Ago … In a Lost Land Cycle Time Was King of the Magic World
Kingdom Conditions • High Volume of Supply • Scarcity of Quality Technicians • Supply Chain Strong
Many Magicians Thought • Higher Labor Gross Profits Meant • Higher Total Gross Profits • Higher Productivity
Younger Magicians Thought • Cycle Time Could Be Reduced if … • More Parts Replaced • Gross Profit Per Hour Increases • Gross Profit % Decreases • Throughput Increases
Other Parts MU PU Hood 486.90 1.3 3.1 Underside 1.5 Clear Coat 1.8 PaintMaterials 160.00 The Magic of Replacement 2004 Buick LeSabre Unit Rate Example $40.00 Paint and Materials Example $25.00/PU
Other Parts MU PU Hood 486.90 1.3 3.1 Underside 1.5 Clear Coat 1.8 PaintMaterials 160.00 Magical Analysis of Replacement 160.00 256.00 52.00 486.90 Total Cost - 954.90 Replace vs. Repair - 158% Repair vs. Replace - 63%
Gross Profit $ Gross Profit % Parts $486.90 30.00% $146.07 Metal Labor $52.00 60.00% $31.20 38.84 % Paint Labor $256.00 60.00% $153.60 Materials $160.00 25.00% $40.00 $370.87 Cycle Time Analysis of Replacement Metal Labor Efficiency 150% = .87 Paint Labor Efficiency 200% = 3.2 Materials Only Paint Related $370.87 ÷ 4.07 (.87 + 3.2) = $91.12 Per Hour
Lower Cycle Times Lower Skill Level Lower Material Costs Less Failures Increase Sales Better Discounts Increase Throughput Higher Ticket Lower GP % Planning Issues Staffing Needs Supplier Issues Deliveries Unpredictable LKQ Unpredictable Aftmkt Replace over Repair Disadvantages Advantages
Gross Profit $ Gross Profit % Parts $486.90 35.00% $170.42 Metal Labor $52.00 65.00% $33.80 44.17 % Paint Labor $256.00 60.00% $153.60 Materials $160.00 40.00% $64.00 $421.82 Management Magical Improvements Metal Labor Efficiency 150% = .87 Paint Labor Efficiency 200% = 3.2 Materials Only Paint Related $421.82 ÷ 4.07 (.87 + 3.2) = $103.64 Per Hour
Times Changed Frequency DecreasedWork Volume Decreased KPI’s Changed
The Illusion of Repair 2004 Buick LeSabre Other Parts MU PU Hood 8.0 3.1 Underside 1.0 Clear Coat 1.8 PaintMaterials 147.50 Unit Rate Example $40.00 Paint and Materials Example $25.00/PU
Other Parts MU PU Hood 8.0 3.1 Underside 1.0 Clear Coat 1.8 PaintMaterials 147.50 Basic Analysis of Repair 147.50 236.00 320.00 Total Cost – 703.50 Replace vs. Repair - 74% Repair vs. Replace - 136%
Cycle Time Analysis of Repair Gross Profit $ Gross Profit % Parts Metal Labor $320.00 60.00% $192.00 52.66 % Paint Labor $236.00 60.00% $141.60 Materials $147.50 25.00% $36.88 $370.48 Metal Labor Efficiency 200% = 4.00 Paint Labor Efficiency 150% = 3.93 Materials More Materials Consumed $370.48 ÷ 7.93 (4.00 + 3.93) = $46.72 Per Hour
Maximize GP % Lowers Ticket Cost Scorecard Points Increased Costs Defects - Warranties Skill Level Issues Staffing Issues Less Throughput Creates Bottlenecks Paint Department Repair over Replace Disadvantages Advantages
Are We to Work Together ? Common Areas to Work Together
Common Goal • Vehicle Owner Focused • Restore Vehicle Back to Pre-Accident Condition • Work to Keep Costs in Control • Allow For Necessary Operations • Perform Necessary Operations • Use Common Sense
Common Understanding • Take a Holistic Approach to KPI’s • Not Focusing Only with Blinders On • Consistency of Performance Targets Lack of Understanding and Consistency … Leads to Nothing But Bad Things …
Hydraulics of the Magical KPI’s Replacement Percentage Labor Skill Level Labor IndirectDirect Paint Department Efficiency PaintMaterials Costs GrossProfitPer Hour CycleTime Every Action Causes an Equal and Opposite Reaction
Common Grounds • Fraud Definition • Abide by State Laws • Incorporate CIC Guidelines • Write it Right • Work Together on Definitions • Solutions
Definitions to Define • Metal Labor Repair Units • To 180 Grit … • Not New Undamaged Panel Condition • Additional Materials Required • Not Paint and Materials … Body Materials • Information Systems • Allow More Repair Than Part Cost
Definitions to Define • Paint Labor Units • New Panels = New Panel Units • New Undamaged Panel Condition • Paint Labor Units • Repair Panels • Need Additional Operations
Definitions to Define • Blending Base Within a Panel • Paint Labor Units • Repair Panels • Need Additional Operations • Affects Paint Materials
Directions Not to Take • Repair Operation Cost Shifting • Bundle R&I to Improve Ratio • Front Bumper Cover • Add Hours to Include Part Costs • Door Skin • Hood (Used)
Directions to Take • Work Together • Improve Training • Repair is a Lost Art • Smart Repairs Understand the Hydraulics of KPI’s