Download
1 / 16
170 likes | 504 Vues
Warm UP!. The length of human pregnancies from conception to birth varies according to a distribution that is approximately normal with mean 264 days and standard deviation 16 days. Consider 15 pregnant women from a rural area. Assume they are equivalent to a random sample from all women.

E N D
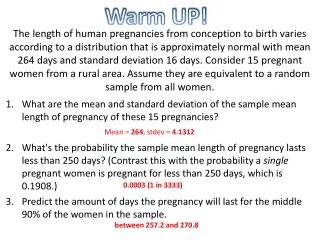
Warm UP! The length of human pregnancies from conception to birth varies according to a distribution that is approximately normal with mean 264 days and standard deviation 16 days. Consider 15 pregnant women from a rural area. Assume they are equivalent to a random sample from all women. • What are the mean and standard deviation of the sample mean length of pregnancy of these 15 pregnancies? • What's the probability the sample mean length of pregnancy lasts less than 250 days? (Contrast this with the probability a single pregnant women is pregnant for less than 250 days, which is 0.1908.) • Predict the amount of days the pregnancy will last for the middle 90% of the women in the sample. Mean = 264, stdev = 4.1312 0.0003 (1 in 3333) between 257.2 and 270.8
Confidence Intervals A soda factory produces 100mL sodas. We want to know the average mL in every bottle in the population produced by the factory. We know that the standard deviation of the population is 6mL. We take a sample of 36 bottles of soda and find the sample mean to be 95 mL. Just because our sample shows an average of 95 mL, can we assume the population average is, too? EQ: What level of confidence do I have?
Confidence Intervals What do we know about the sample distribution? The CLT tells us that it is normally distributed because the sample size is more than 30 The sampling distribution will not be as dispersed as the population. Find the standard error. EQ: What level of confidence do I have?
Confidence Intervals Can we estimate the mean of the population? YES… but we want to know how confident our estimate is What is the chance the mean of the population is actually 94mL but when sampling our data we accidently found a mean of 95mL? EQ: What level of confidence do I have?
Confidence Intervals According to the normal curve, there is a 34% chance that our population mean will fall 1 standard deviation above sample mean. There is also a 34% chance that our population will fall 1 standard deviation below the sample mean. So there is a 68% confidence interval when saying that the actual population mean is between 94 and 96 mL or EQ: What level of confidence do I have?
95% Confidence Interval There is a 47.5% chance the population mean is 2 standard deviations above the mean, and a 47.5% chance the population mean is 2 standard deviations below the mean. The 95% confidence interval is between 93 and 97 mL. EQ: What level of confidence do I have?
Confidence Intervals • Suppose that the mean SATM score for seniors in Georgia was 550 with a standard deviation of 50 points. Consider a simple random sample of 100 Georgia seniors who take the SAT. Describe the distribution of the sample mean scores. • The distribution, given that there are more than 1000 seniors who take the SAT, should be approximately normal. • What are the mean and standard deviation of this sampling distribution? • The mean is 550 and the standard deviation is 5. EQ: What level of confidence do I have?
Confidence Intervals • We can be confident that 68% of the data falls between (545, 555) • We can be confident that 95% of the data falls between (540, 560). • We can confident that 99.7% of the data falls between (535, 565). EQ: What level of confidence do I have?
Confidence Intervals For the 95% interval, this means that in 95% of all samples of 100 students from this population, the mean score for the sample will fall within ___ standard deviations of the true population mean or ____ points from the mean. The interval of numbers found, i.e. (540, 560) is called a 95% confidence intervalfor the population mean. The confidence level is 95% EQ: What level of confidence do I have?
Confidence Intervals For this problem, we knew the population mean, but remember, in practice, we often do not. So we take samples and create confidence intervals as a method of estimating the true value of the parameter. When we find a 95% confidence interval, we believe with 95% confidence that the true parameter falls within our interval. However, we must accept that 5% of all samples will give intervals which do not include the parameter. EQ: What level of confidence do I have?
Confidence Intervals A confidence interval is used to describe how we feel about the population parameters Every confidence interval takes the same shape: estimate margin of error. In the interval (540, 560), the margin of error is 10. The margin of error has two main components: the number of standard deviations from the mean (i.e. the z-score) and the standard deviation. Margin of error = z * Because we do not usually know the details of a population, we must use estimates of these values. So our margin of error becomes m = z(estimate). Therefore, the confidence interval becomes estimate margin of error estimate z(estimate). EQ: What level of confidence do I have?
Margin of Error The margin of error is simply a measure of how "precise" the data are. NOT how accurate the data are. Necessary because few organizations have the time or money to survey the entire population on a particular subject. Rather, "samples" of the population are taken using various surveying techniques. As a result, it is necessary to know how precisely the results of the sample reflect true feelings of the entire population. EQ: What level of confidence do I have?
Confidence Intervals The z-score used in the confidence interval depends on how confident one wants to be. There are a few common levels of confidence used in practice: 90%, 95%, and 99% The Empirical Rule provides estimates for the amount of data within specified numbers of standard deviations, and therefore, can help us find approximate intervals for being 68%, 95%, and 99.7% confident that we have included the true population parameter. EQ: What level of confidence do I have?
finding closer estimates for the number of standard deviations from the mean Within how many standard deviations of the mean would one locate the middle 95% of the data? This is a question about z-scores. If 95% is in the middle, then 2.5% is on each end of the normal curve. So, the area under each end is 0.025. Using the standard normal table, an area of .025 is located exactly at the z-score of -1.96. Because the curve is symmetric, the upper z-score is 1.96.
Within how many standard deviations of the mean would one locate the middle 90% of the data If 90% is in the middle, then 5% is on each end. So the area under each end is 0.05. Using the standard normal table, an area of .05 is half way between the area of .0495 (z-score of -1.65) and an area of .0505 (z-score of -1.64). We can reason that the appropriate lower z-score is -1.645. Because the curve is symmetric, the upper z-score is 1.645. EQ: What level of confidence do I have?
Common Confidence Levels For the common confidence levels, then, we have the following z-scores, called z*. Complete the following table in your notes: For any confidence intervals you are expected to compute by hand, you will use these z* values. Thus, our final form of the confidence interval is estimate z*(estimate). EQ: What level of confidence do I have?