water
340 likes | 369 Vues
Explore the unique properties of water, its hydrogen bonding, and influence on ionic interactions and enzyme-substrate complexes in biological systems.

water
E N D
Presentation Transcript
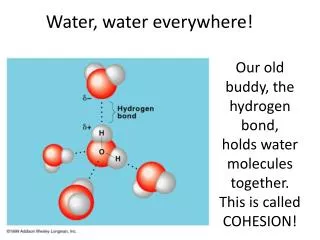
FIGURE 2–1 Structure of the water molecule FIGURE 2–2 Hydrogen bonding in ice. FIGURE 2–3 Common hydrogen bonds in biological systems
FIGURE 2–5 Directionality of the hydrogen bond. Water is especially effective in screening the electrostatic interactions between dissolved ions because it has a high dielectric constant, a physical property reflecting the number of dipoles in a solvent. The strength, or force (F), of ionic interactions in a solution depends upon the magnitude of the charges (Q), the distance between the charged groups (r), and the dielectric constant () of the solvent in which the interactions occur:
FIGURE 2–7 Amphipathic compounds in aqueous solution. (a) Long chain fatty acids have very hydrophobic alkyl chains, each of which is surrounded by a layer of highly ordered water molecules.
FIGURE 2–7 Amphipathic compounds in aqueous solution. (b) By clustering together in micelles, the fatty acid molecules expose the smallest possible hydrophobic surface area to the water, and fewer water molecules are required in the shell of ordered water.
FIGURE 2–8 Release of ordered water favors formation of an enzyme-substrate complex.
FIGURE 2–9 Water binding in hemoglobin. The crystal structure of hemoglobin, shown (a) with bound water molecules (red spheres) and (b) without the water molecules. These water molecules are so firmly bound to the protein that they affect the x-ray diffraction pattern as though they were fixed parts of the crystal.
FIGURE 2–10 Water chain in cytochrome f.Water is bound in a proton channel of the membrane protein cytochrome f, which is part of the energy-trapping machinery of photosynthesis in chloroplasts
in which R is the gas constant and T is the absolute temperature. The term ic is the osmolarity of the solution, the product of the solute’s molar concentration c and the van’t Hoff factor i, which is a measure of the extent to which the solute dissociates into two or more ionic species. FIGURE 2–11 Solutes alter the colligative properties of aqueous solutions. (a) At 101 kPa (1 atm) pressure, pure water boils at 100 C and freezes at 0 C. (b) The presence of solute molecules reduces the probability of a water molecule leaving the solution and entering the gas phase, thereby reducing the vapor pressure of the solution and increasing the boiling point
FIGURE 2–12 Osmosis and the measurement of osmotic pressure. (a) The initial state. The tube contains an aqueous solution, the beaker contains pure water, and the semipermeable membrane allows the passage of water but not solute. Water flows from the beaker into the tube to equalize its concentration across the membrane. (b) The final state. Water has moved into the solution of the nonpermeant compound, diluting it and raising the column of water within the tube. At equilibrium, the force of gravity operating on the solution in the tube exactly balances the tendency of water to move into the tube, where its concentration is lower. (c) Osmotic pressure () is measured as the force that must be applied to return the solution in the tube to the level of that in the beaker. This force is proportional to the height, h, of the column in (b). FIGURE 2–13 Effect of extracellular osmolarity on water movement across a plasma membrane
FIGURE 2–16 Conjugate acid-base pairs consist of a proton donor and a proton acceptor.
FIGURE 2–18 Comparison of the titration curves of three weak acids
where [CO2(d)] is the concentration of dissolved CO2 ,the [HCO3 ] is expressed as mEq/mL, and PaCO2 as mm Hg. The constant of 0.03 is a solubility constant that also corrects for the use of different units.