Download
1 / 30
300 likes | 311 Vues
This presentation discusses the design of a low impact development (LID) soil matrix for bio-remediation in the City of Flagstaff. The design aims to reduce pollution levels and improve stormwater management. The presentation includes soil identification, vegetation assessment, soil testing, soil media testing, stormwater sampling, and coliform testing.

E N D
City of Flagstaff Low Impact Development (LID) Bio-Remediation Soil Design Final Presentation Thursday, November 29th, 2018. Engineering Team: Meshal Alomar, Abdulrahman Alsubiei, Daniel’leDeVoss, Rebeca Robles Client and Grading Instructor: Mark Lamer Technical Advisor: Adam Bringhurst
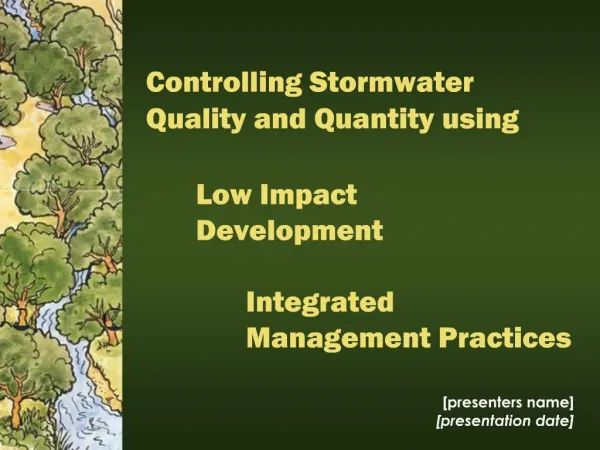
Low Impact Development (LID) Introduction CONVENTIONAL SYSTEM Pollution Accumulated Large Volume Pollution Remediation LID SYSTEM Pollution Accumulated Reduced Volume Groundwater Recharge Stormwater Runoff
Low Impact Development (LID) Introduction • Capstone Project Goals: • Design a soil matrix with only locally sourced materials • Design a soil matrix that infiltrates the first inch of stormwater in one hour • Assess the bio-remediating efficacy • Assess impact of adding vegetation VEGETATION Figure 1. LID Cross-section
Soil Identification Figure 2. 2017 LID Capstone Final Round Column Designs [1] • Soil materials chosen based on the 2017 LID Capstone Final Design Report columns 2 and 6. • Mulch layer avoided since team was growing grass on topsoil for further testing. • Soil materials obtained from The Landscape Connection.
Soil Identification Table 1. Soil Materials Summary [2]
Grass Layer Assessment • Team wanted to assess the impact of a grass layer on infiltration rates and treatment. • Team selected a native grass mix from Warner’s Nursery in Flagstaff, Arizona. Table 2. Native Grass Mix % and Origins [3] Figure 3. Grown Grass Layer by Rebeca Robles
Soil Testing Concrete Sand River Rock • Team tested the following on soil materials: • Hydraulic Conductivity • Specific Gravity • Saturated Surface Dry (SSD) Test Cinder Sand Cinder Gravel Topsoil Figure 4. Soil Materials by Rebeca Robles
Hydraulic Conductivity, Void Ratio, and Porosity • Followed ASTM D5856-15 • Conducted on all four-soil material (3 tests per type of soil) Void Ratio Porosity * 100% Hydraulic Gradient Density of Soil Sample L= Length V= Volume A= Area M1= mass of the permeameter device without soil M2= mass of the permeameter device with soil Gs= Specific Gravity H= Height Pd= Density of The Compacted Soil Q= Flow rate Hydraulic Conductivity Figure 5. Hydraulic Conductivity Example [4]
Hydraulic Conductivity, Void Ratio, and Porosity Results Table 3. Hydraulic Conductivity Summary Table
Specific Gravity and SSD Test Specific Gravity Saturated Surface Dry Specific Gravity SSD Absorption Wd= Mass of dry soil Wsat= Mass of saturated soil WSSD = Mass of Saturated surface dry Absorption * 100% • Followed ASTM C127-15 for coarse aggregates and ASTM C128-15 for fine aggregates. • Conducted only on screened cinders, river rocks, and concrete sand at the Western Technologies Inc. lab and were recommended to not do testing on topsoil.
Specific Gravity and SSD Test Table 4. Specific Gravity and SSD Summary Table
Soil Matrix Design • 2017 LID Capstone Soil Matrix Testing Method [1]: • Similar to Percolation Test. • Dry Test • Saturated Test right after dry test to mimic worst case scenario of multiple storms within a short period of time. • Void Space Volume Test Figure 7. Infiltrated Water Collection by Daniel’le De Voss Figure 6. Testing Unit by Rebeca Robles
Soil Media Testing Round #1 Figure 8. Soil Media Testing Round #1 Graph • Designs based on column designs 2017 LID Capstone Final Design Report. • Designs conducted with different sands.
Soil Media Testing Round #2 Figure 9. Soil Media Testing Round #2 Graph • Experimented with different topsoil mix layer heights and with a topsoil mix with grass layer.
Soil Media Testing Round #1 and #2 Results Table 5. Soil Media Testing Round #1 Results Table 6. Soil Media Testing Round #2 Results
Soil Media Testing Round #3 • Retested Design #4, and tested Design #4 with a grass layer Table 7. Soil Media Testing Round #3 Results Table 8. Soil Media Testing Round #3 Results (2)
Stormwater Sampling Figure 10. Contaminating Water by Pouring Over Outdoor Stairs by Daniel’le DeVoss Figure 11. Contaminating by Pouring Over a Dumpster Lid by Daniel’le DeVoss
Stormwater Testing • Tested the stormwater turbidity, total phosphorus, and total coliform before and after infiltrating it through the soil media columns to assess the columns ability to remediate. Design #4 with Grass Design #4 Design #4 Design #4 with Grass 1 1 1 1 2 2 2 2 3 3 3 3
Turbidity and Total Phosphorous Testing • Followed ASTM D6855-12 for Turbidity • Followed HACH Method #10127 for Total Phosphorous Water Treated without Grass Water Treated with Grass Untreated Water Figure 12. Untreated and Treated Water Samples by Daniel’le DeVoss
Coliform Testing • Followed HACH Method #8074 Water Treated with Grass Untreated Water Water Treated without Grass Figure 13. Vacuum Filtration Apparatus By Daniel’leDeVoss Figure 14. Petri Dishes After Incubation by Daniel’leDeVoss
Coliform Testing Figure 15. Diluted Samples and Close-up of Isolated Colonies by Daniel’le DeVoss
Summary of Water Quality Results Table 9. Stormwater Quality Results Summary
Selecting Final Matrix Design • Design #4 with a Grass Layer was selected as the final soil matrix design: • Infiltration Rate = 9.1 in/hr • Storage Capacity = 7.3 L/ft2 • Ability to treat different stormwater contaminants. • For a proposed Area of 500 ft2: • Total Water Storage Capacity = 128.47 ft3or 3,637.86 L Figure 16. Final Soil Matrix Design
Project Impacts Figure 17. City of Kirkland, WA LID [5] • Economic Impact • Prevent infrastructure damages caused by floods. • Reduce the cost of water treatment • Environmental Impact • Reduction of sediments, nutrients, and coliform from the stormwater runoff. • Social Impact • Enhancing community aesthetics using natural elements. Figure 18. Concrete stow water management system [6]
Project Schedule Figure 19. Schedule Gantt Chart
Engineering Work Table 10. Estimated Staffing Hours Table
Engineering Work Table 11. Actual Staffing Hours Table
Engineering Costs Table 12. Total Staffing Costs Summary Table [7]
Construction Costs Table 13. Total Excavation Cost Summary Table [8] Table 14. Total Grass Cost Summary Table [4] Table 15. Total Soil Materials Cost Summary Table [2]
References [1] R. Pott; T. Alhamidi; F.DiFore; Z.Zhang. “CENE 486 Final Capstone Report: Low Impact Development Bio-Remediation Soil Design.” 2017. [2]Connection, T. (2010). Materials List. [online] The Landscape Connection. Available at: https://www.landscapeconnection.biz/materials-list.html [Accessed 10 Nov. 2018]. [3] Warner’s Nursery. (2018). Grass Compositions and Prices. [4] https://knowledge4civil.wordpress.com/2016/12/11/flow-of-water-through-soil/ [5] “Low Impact Development,” City of Kirkland official website. [Online]. Available: https://www.kirklandwa.gov/depart/Public_Works/Utilities/Storm___Surface_Water/Development_and_Construction/Low_Impact_Development.htm. [6] “What Does the Storm Drainage System Look Like?,” Fairfax County Virginia. [Online]. Available: https://www.fairfaxcounty.gov/publicworks/stormwater/what-does-storm-drainage-system-look. [7] “ PROFESSIONAL CONSTRUCTION MATERIALS ENGINEERING & TESTING SERVICE FEE SCHEDULE FOR NOBLE MIDSTREAM SERVICES, LLC,” p. 2016, 2016. [8] 108 excavating. (2017). 108 EXCAVATING. [online] Available at: http://www.108excavating.com/ [Accessed 28 Nov. 2017].