Download
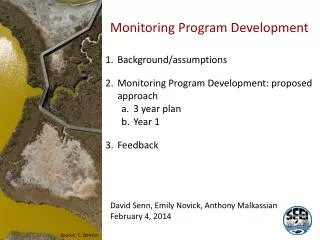
1 / 27
270 likes | 403 Vues
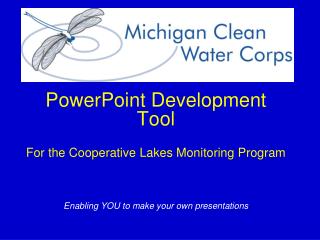
PowerPoint Development Tool For the Cooperative Lakes Monitoring Program Enabling YOU to make your own presentations. What is the purpose of this PowerPoint?. The resources contained in this PowerPoint file are to help anyone interested in the MiCorps program develop their own presentation.

E N D
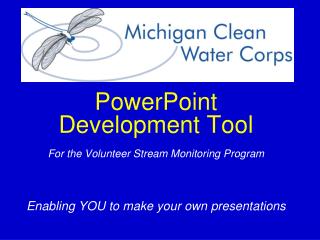
PowerPoint Development Tool For the Cooperative Lakes Monitoring Program Enabling YOU to make your own presentations
What is the purpose of this PowerPoint? • The resources contained in this PowerPoint file are to help anyone interested in the MiCorps program develop their own presentation. • Simply keep the slides you are interested in, delete those you are not. • Use the excel file to create graphs using your own data and paste them into this presentation. • Download it here www.micorps.net/documents/CLMP_Graph_Builders.xls
MiCorps Overview
“Together, we’ll create the nation’s most comprehensive and meaningful clean water monitoring system, building a water legacy for generations to come.” Former Governor Jennifer Granholm 2003
MiCorps Mission Network and expand volunteer water quality monitoring organizations statewide for the purpose of collecting, sharing, and using reliable data. Educate and inform the public about water quality issues. Foster water resources stewardship to facilitate the preservation and protection of Michigan’s water resources.
MiCorps- How does it work? • MiCorps consists of two main programs concentrating on volunteer stream and lake monitoring. • Volunteer Stream Monitoring Program (VSMP) • Cooperative Lakes Monitoring Program (CLMP) • Other components of MiCorps that support the 2 main programs are: • - Grants (Streams only) • - Trainings • - Annual Conference • - Newsletter • - Email ListServ for discussion and news • - Web site • - Web-based, publically available, searchable database
MiCorps concentration in quality assurance gives us… Better data and information More consistent and complete Quality controlled and assured Broadly collected Greater use by the DNRE and local managers in planning and management Continued funding of the program.
CLMP Goals • Provide baseline information and document trends in water quality for individual lakes. • Educate lake residents, users, and interested citizens in collection of water quality data, lake ecology, and lake management practices.
CLMP Goals • Build a constituency of citizens to practice sound lake management at the local level and build public support for lake quality protection. • Provide a cost-effective process for the DNRE to increase baseline data for lakes in Michigan.
CLMP Membership 2010 number: ~225 Lakes monitored by lake associations or individuals
Transparency Total Phosphorus Chlorophyll a Dissolved Oxygen and Temperature Aquatic Plants What do we measure in the CLMP?
What is expected of volunteers? There is a slight cost for volunteers to enroll their lake into the program ($20-60, depending on parameter, plus one time equipment costs) Volunteers are expected to take weekly or biweekly transparency measurements. Other measurements may need to be taken monthly. Volunteers are asked to attend an annual training and follow directions carefully. Sample turn in: twice during the sampling season volunteers are asked to bring their samples into a local DNRE office.
And what does the CLMP provide in return? The potential for long term data on your lake (the program has been operating since 1973). Training Analyzes your water samples Excellent quality assurance procedures A volunteer mentor program to get you help if you need it.
Doesn’t CLMP provide a magic formula for fixing lakes? • No. The CLMP only provides a way for you to collect the baseline data that is needed to make proper management decisions. • It takes further effort, further resources, and committed riparian owners and state and local governments to carry out these management decisions.
What do transparency, phosphorus, and chlorophyll measurements tell us about a lake? • Observing long-term trends of these parameters can help us understand if the amount of algae is increasing in the lake over time. • If trends shows the decreases of transparency, and increases of phosphorus and chlorophyll of the lake, then steps need to be taken to reduce the amount of nutrients coming into the lake. • Otherwise the lake may be headed toward eutrophication (murky water is undesirable for swimming; low oxygen can kill fish).
Secchi Disk Transparency Trends This graph was created by the CLMP Graph Builder excel file, downloadable at www.micorps.net/documents/CLMP_Graph_Builders.xls Download this file to make your own graphs and paste them into this presentation!
Phosphorus Trends This graph was created by the CLMP Graph Builder excel file, downloadable at www.micorps.net/documents/CLMP_Graph_Builders.xls Download this file to make your own graphs and paste them into this presentation!
Chlorophyll Trends This graph was created by the CLMP Graph Builder excel file, downloadable at www.micorps.net/documents/CLMP_Graph_Builders.xls Download this file to make your own graphs and paste them into this presentation!
Trophic Status Index (TSI) • The CLMP uses Carlson’s TSI to classify lakes as • Oligotrophic • Mesotrophic • Eutrophic • Hypereutrophic • Get the TSI values for your lake from the most recent CLMP annual report and use the next slide to classify your lake.
Dead Spider Lake is a Mesotrophic lake Directions 1. Move the 3 dots to the proper location for your lake. 2. Move the 3 lines so they line the dots up with the top bar. 3. The 3 lines indicate the approximate trophic status of your lake. 4. Many lakes will not fit neatly into a single trophic category.
What do dissolved oxygen and temperature profiles tell us about a lake? Define the temperature and density zones of lakes. Thermally classify lakes (warm or cold water) Determines bottom water oxygen depletion. Sediment phosphorus release- phosphorus is released from bottom sediments in anoxic (no oxygen) conditions. Fishery status indicator- what kind of fish can this lake support?
DO and Temp Profiles for Dead Spider Lake May 15, 2010 This graph was created by the CLMP Graph Builder excel file, downloadable at www.micorps.net/documents/CLMP_Graph_Builders.xls Download this file to make your own graphs and paste them into this presentation!
DO and Temp Profiles for Dead Spider Lake June 6, 2010 This graph was created by the CLMP Graph Builder excel file, downloadable at www.micorps.net/documents/CLMP_Graph_Builders.xls Download this file to make your own graphs and paste them into this presentation!
DO and Temp Profiles for Dead Spider Lake July 7, 2010 This graph was created by the CLMP Graph Builder excel file, downloadable at www.micorps.net/documents/CLMP_Graph_Builder.xls Download this file to make your own graphs and paste them into this presentation!
DO and Temp Profiles for Dead Spider Lake July 29, 2010 This graph was created by the CLMP Graph Builder excel file, downloadable at www.micorps.net/documents/CLMP_Graph_Builders.xls Download this file to make your own graphs and paste them into this presentation!
DO and Temp Profiles for Dead Spider Lake August 30, 2010 This graph was created by the CLMP Graph Builder excel file, downloadable at www.micorps.net/documents/CLMP_Graph_Builders.xls Download this file to make your own graphs and paste them into this presentation!