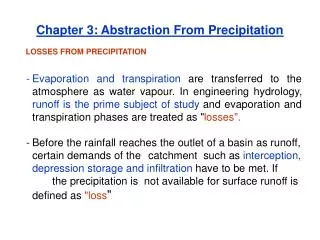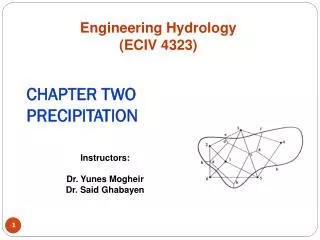
CHAPTER THREE Abstraction From Precipitation
. CHAPTER THREE Abstraction From Precipitation . Engineering Hydrology (ECIV 4323). Instructors: Dr. Yunes Mogheir Dr. Ramadan Al Khatib. LOSSES FROM PRECIPITATION . Evaporation PROCESS. Influencing Factors .

CHAPTER THREE Abstraction From Precipitation
E N D
Presentation Transcript
CHAPTER THREEAbstraction From Precipitation Engineering Hydrology (ECIV 4323) Instructors: Dr. Yunes Mogheir Dr. Ramadan Al Khatib
Influencing Factors Vapour pressures at the water surface and air above: the rate of evaporation is proportional to the difference between the saturation vapour pressure at the water surface (Dalton’s law) Where EL = C (ew – ea) EL : rate of evaporation (mm/day) C : a coefficient depend on wind velocity, atmospheric pressure and other factors ew : the saturation vapour pressure at the water surface (mm of mercury) ea : the actual vapour pressure of air (mm of mercury)
Influencing Factors 2. Air and water temperature: the rate of evaporation increases with an increase in the water temperature. 3. Wind : the rate of evaporation increases with the wind speed up to critical speed beyond which any further increase in the wind speed has no influence on the evaporation rate 4.Atmosphere pressure: a decrease in the barometric pressure ( as in high altitudes), increases evaporation. 5. Quality of water: under identical condition evaporation from sea water is about 2-3% less that from fresh water. 6. Size of water body
Evaporation Measurement • EVAPORIMETER • The most widely used method of finding or monitoring the water body evaporation. • The standard National Weather Bureau Class A pan ( 1.21 m diameter, 25.5 cm depth, it is placed on a wooden structure of 15 cm height).
Pan Coefficient Cp The actual evaporation from a nearby leak is less than that of pan evaporation Why ? • The sides of the pan is exposed to the sun • The temperature over the pan is higher that over the lake Lake evaporation = Cp x pan evaporation Cp = pan coefficient and equal 0.7 for Class A land Pan.
Evaporation Estimations Empirical Evaporation Equation
Evaporation Measurement • Analytical methods
Water-budget method, It involves writing the hydrological continuity equation for the lake and determining the evaporation from a knowledge or estimation of other variables. Thus considering the daily average values for a lake, the continuity equation is written as: EL= P + (Vis- Vos) + (Vig- Vog) – TL – Δ S All quantities are in units of volume (m3) or depth (mm) over a reference Area. p,. Vis, Vos and Δ Scan be measured. However, it is not possible to measure Vig, Vogand TL and therefore these quantities can only be estimated. If the unit of time is kept large, say weeks or months, better accuracy in the estimate of ELis possible. In view of the various uncertainties in the estimated values and the possibilities of errors in measured variables, the water-budget method cannot be expected to give very accurate results.
rainfall throughfall stemflow Interception It is the segment of precipitation that is prevented to reach the ground by vegetation and subsequently evaporates Interception = Rainfall – stemflow – throughfall
Route of interception • Interception loss : rain water retained by the vegetation as surface storage >>>> evaporate 2. Througfall : rain water can drip off the plant leaves to join the ground surface or the surface flow 3. Stem flow: the rain water may run along the leaves and braches and down the stem to reach the ground surface
Influencing Factors • Storm characteristics : rainfall intensity, duration, wind …etc • The vegetation : species, age, density of plants and trees 3.Season of the year: time of plant growing It is estimated of that : of the total rainfall in area during plant-growing season, the interception loss is 10-20 %.
100 Beech trees Interception loss as % Rainfall 80 60 40 20 5 10 15 20 30 Rainfall (mm) Influencing Factors • Estimation of interception can be significant in annual or long-term models • For heavy rainfalls during individual storm events interception is neglected
Estimation of Interception Most interception loss develops during the initial storm period and the rate of interception rapidly approach to zero. Ii = Si + KEt Ii = the volume of water intercepted (mm) SI = the interception storage whose values varies from 0.25 to 1.5 depending on the nature of vegetation Ki = ration of vegetal surface area to its projected area E = Evaporation rate in (mm/h) during the precipitation t = duration of rainfall in hours Horton: Li = 0.015+ 0.23 P (ash trees) Li = 0.03+ 0.22 P (oak trees)
Depression Storage When the precipitation of a storm reaches the ground, it must fill up all depressions before it can flow over the surface The volume of water trapped in these depressions called depression storage
Influencing Factors • Type of soil : 0.50 cm for sand, 0.25 cm fro clay • The condition of the surface : amonut and nature of depression • The slope of Catchment • The soil moisture
Soil water zone – max depth from which water can be returned to surface through capillary action or ET. Unsaturated zone Transmission zone, uniform moisture content, not saturated Gravitational water – flow direction is vertical due to gravity. (unsaturated zone or zone of aeration) Capillary zone, less than atmospheric pressure Wetting Front Groundwater, saturation at atmospheric pressure Infiltration Is the process by which precipitation moves down through the surface of the earth and replenishes soil moisture recharge aquifers, and ultimately support runoff quantities.
Infiltration Capacity Infiltration capacity (fc): The maximum rate at which a given soil at a given time can a absorb water (cm/h) The actual rate of infiltration f can be expressed as : f = fc when i ≥ fc f = i when i < fc Where i = the intensity of rainfall The infiltration capacity of a soil is high at the beginning of a storm and has and extensional decay at the time elapses.
Measurement of Infiltration There are two kinds of infiltrometers : • Flooding-type infiltrometer, and
Horton’s Infiltration Model • If the rainfall supply exceeds the infiltration capacity, the infiltration tends to decrease in exponential manner Where : fct : the infiltration capacity (depth/time) at any time t from the start of the rainfall ffc: a final or equilibrium capacity fco: the initial infiltration capacity Kh: a constant representing the rate of decrease in f capacity td: duration of the rainfall
Runoff volume Volume Losses Time -INDEX • index is determined for a single storm and not applicable to other storm and • Large storm on wet soil and - Infiltration rate may be assumed to be relatively uniform Volume losses includes the interception, depression storage and infiltration Intensity
Example 3.5 • A storm with 10.0 cm precipitation produce a direct runoff of 5.8 cm given the time distribution of the storm as below, estimate the - INDEX of the storm?
Solution: Total infiltration = 10.0-5.8 = 4.2 cm Assume the time of rainfall excess = 8 hr (for the first trail) Then Ф = 4.2/8 = 0.525 cm/h This value makes the rainfall of the first hour and eight hour ineffective as their magnitude is less than 5.25 cm/h. Assume the time of rainfall excess = 6 hr (for the second trail) Infiltration = 10-0.4-0.5-5.8 = 3.3 cm Then Ф = 3.3/6 = 0.55 cm/h and by calculating the rainfall excesses then total rainfall excesses= 5.8 = total runoff
WH3 • 3.2 • 3.4 • 3.9 • 3.13