Exploring the Impact of Cumulative Lead Exposure on Blood Lead Levels in Young Children in Montreal
The Montreal Lead Study investigates the relationship between cumulative lead exposure and blood lead levels (BLL) in children aged 1 to 5 years. Conducted since 2009, the study addresses the relevancy of lead exposure data in Canadian children amidst declining environmental lead levels. This research emphasizes the use of a Cumulative Lead Exposure Index (CLEI) alongside cross-sectional measures, focusing on diverse demographics, including Caucasian and higher-risk populations. The objective is to better understand the effects of lead exposure pathways on children's health outcomes.

Exploring the Impact of Cumulative Lead Exposure on Blood Lead Levels in Young Children in Montreal
E N D
Presentation Transcript
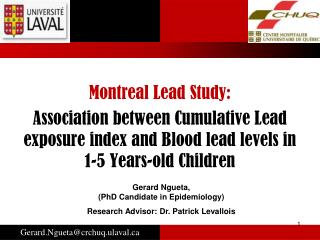
Montreal Lead Study: Association between Cumulative Lead exposure index and Blood lead levels in 1-5 Years-old Children GG Gerard Ngueta, (PhD Candidate in Epidemiology) Research Advisor: Dr. Patrick Levallois Gerard.Ngueta@crchuq.ulaval.ca
INTRODUCTION OBJECTIVES METHODOLOGY RESULTS CONCLUSIONS AND PERSPECTIVES Relevance of Montreal Lead Study Difference from earlier association studies G mt • MontrealLead Study Undertaken in 2009 and firstly designed to assess lead exposure in 1-5 years old children living in Montreal city US E.P.A reports indicating the global decrease of environmental lead exposure and huge reduction of BLL in young children. Montreal Study remains relevant because of poor data published in Canadian children (aged under 6). Gerard.Ngueta@crchuq.ulaval.ca
INTRODUCTION OBJECTIVES METHODOLOGY RESULTS CONCLUSIONS AND PERSPECTIVES Relevance of Montreal Lead Study Differencefromearlier association studies G mt • Strong association betweenenvironmental lead and BLL Reported in several previous studies and reports In most cases, they were cross-sectional association studies Most of children included were those with high risk of lead exposure [Black and Hispanic origin > 50% population study] The present study differs from earlier: • Caucasian children ≈ 67% of population study • Cumulative lead exposure index (CLEI) in addition to cross-sectional measures of exposure Gerard.Ngueta@crchuq.ulaval.ca
INTRODUCTION OBJECTIVES METHODOLOGY RESULTS CONCLUSIONS AND PERSPECTIVES Relevance of Montreal Lead Study Difference from earlier association studies G mt • Motivation for using CLEI ? Previous studies indicated that lead has a half-life of approximately 30 days in the blood Greenbalt reported that the time required to find steady-state is approximately four-to-five times the elimination half-life after a single exposure [Annual review of medicine36, 421-427] There is a scientific reason to believe that BLL at a given time is more related to lead exposure experienced during 3-5 months before that time. Gerard.Ngueta@crchuq.ulaval.ca
INTRODUCTION OBJECTIVES METHODOLOGY RESULTS CONCLUSIONS AND PERSPECTIVES Relevance of Montreal Lead Study Difference from earlier association studies G mt • Motivation for using CLEI ? Gerard.Ngueta@crchuq.ulaval.ca
INTRODUCTION OBJECTIVES METHODOLOGY RESULTS CONCLUSIONS AND PERSPECTIVES Relevance of Montreal Lead Study Difference from earlier association studies G mt • Motivation for using CLEI ? Gerard.Ngueta@crchuq.ulaval.ca
INTRODUCTION OBJECTIVES METHODOLOGY RESULTS CONCLUSIONS AND PERSPECTIVES Relevance of Montreal Lead Study Difference from earlier association studies G mt • Motivation for using CLEI ? Previous studies indicated that lead has a half-life of approximately 30 days in the blood Greenbalt reported that the time required to find steady-state is approximately four-to-five times the elimination half-life after a single exposure [Annual review of medicine36, 421-427] There is a scientific reason to believe that PbS at a given time is more related to lead exposure experienced during 3-5 months before that time. We hypothesize that cumulative lead exposure would be more suitable to assess the association between Environmental lead and BLL Gerard.Ngueta@crchuq.ulaval.ca
INTRODUCTION OBJECTIVES METHODOLOGY RESULTS CONCLUSIONS AND PERSPECTIVES G mt • Objectives of study To estimate the effects of both CLEI and cross-sectional measures of water lead and residential dust lead on BLL in children aged 1 to 5. To assess the association between both measures of exposure and the likelihood of BLL greater or equal to 2 µg/dl. Gerard.Ngueta@crchuq.ulaval.ca
INTRODUCTION OBJECTIVES METHODOLOGY RESULTS CONCLUSIONS AND PERSPECTIVES Population Study Samples collection Cumulative exposure variables Overview on Statistical analysis G mt • Where are childrenfrom ? Selected from four large districts: • Mercier-Hochelaga-Maisonneuve • Saint-Laurent • Verdun • Villeray-Saint-Michel-Parc-Extension Gerard.Ngueta@crchuq.ulaval.ca
INTRODUCTION OBJECTIVES METHODOLOGY RESULTS CONCLUSIONS AND PERSPECTIVES Population Study Samples collection Cumulative exposure variables Overview on Statistical analysis G mt • Who are they? Child should drink tap water regularly [1] be born in Canada, [2] live in the residence for at least one year, [3] not live outside home more than 2 days per week [4] no suffer from severe disease [5] Families should not use a water filtration system [6] Families should live in single-house unit or multi-units apartments with 3 levels or less [7] 306 children aged under 6 Gerard.Ngueta@crchuq.ulaval.ca
INTRODUCTION OBJECTIVES METHODOLOGY RESULTS CONCLUSIONS AND PERSPECTIVES Population Study Samples collection Cumulative exposure variables Overview on Statistical analysis G mt • Who are they? Gerard.Ngueta@crchuq.ulaval.ca
INTRODUCTION OBJECTIVES METHODOLOGY RESULTS CONCLUSIONS AND PERSPECTIVES Population Study Samples collection Cumulative exposure variables Overview on Statistical analysis G mt • Who are they? Median (p25-p75): Expressed in µg/dL Gerard.Ngueta@crchuq.ulaval.ca
INTRODUCTION OBJECTIVES METHODOLOGY RESULTS CONCLUSIONS AND PERSPECTIVES Population Study Samples collection Cumulative exposure variables Overview on Statistical analysis G mt • Samples collection Largely described elsewhere Water samples WLLS1 WLLS3 WLLF5 WLLS2 WLLS4 5 min flushing 30 min of stagnation Gerard.Ngueta@crchuq.ulaval.ca
INTRODUCTION OBJECTIVES METHODOLOGY RESULTS CONCLUSIONS AND PERSPECTIVES Population Study Samples collection Cumulative exposure variables Overview on Statistical analysis G mt • Sample collection Largely described elsewhere Water samples Dust samples Windowsill dust : Floor dust: sampled in the center of the available floor space 1) Child’s room 2) Home entrance 3) Another room frequently used Gerard.Ngueta@crchuq.ulaval.ca
INTRODUCTION OBJECTIVES METHODOLOGY RESULTS CONCLUSIONS AND PERSPECTIVES Population Study Samples collection Cumulative exposure variables Overview on Statistical analysis G mt • Sample collection Largely described elsewhere Water samples Dust samples Paint samples • X-ray fluorescence evaluation • Collection of paint chips and lab measurement of lead level Gerard.Ngueta@crchuq.ulaval.ca
INTRODUCTION OBJECTIVES METHODOLOGY RESULTS CONCLUSIONS AND PERSPECTIVES Population Study Samples collection Cumulative exposure variables Overview on Statisticalanalysis G mt • Cumulative lead exposure index Firstly: Modeling seasonal changes of environmental lead CLEI for water CLEI = Qe*0.50*∑ [WLLi*exp(-(Ln 2/30)*(N-i))] (expressed in µg) Daily amount of water consumed N from 0 to 149 mean water lead level observed for the day i before day of visit Gastrointestinal absorption rate Gerard.Ngueta@crchuq.ulaval.ca
INTRODUCTION OBJECTIVES METHODOLOGY RESULTS CONCLUSIONS AND PERSPECTIVES Population Study Samples collection Cumulative exposure variables Overview on Statisticalanalysis G mt • Cumulative lead exposure index Firstly: Modeling seasonal changes of environmental lead CLEI for water CLEI = Qe*0.50*∑ [WLLi*exp(-(Ln 2/30)*(N-i))] (expressed in µg) Worst-case exposure scenario: refers to the highest water lead concentration in the samples collected after stagnation time of 30 minutes. Best-case exposure scenario: refers to the sample collected after 5 minutes of flushing Gerard.Ngueta@crchuq.ulaval.ca
INTRODUCTION OBJECTIVES METHODOLOGY RESULTS CONCLUSIONS AND PERSPECTIVES Population Study Samples collection Cumulative exposure variables Overview on Statistical analysis G mt • Cumulative lead exposure index Firstly: Modeling seasonal changes of environmental lead CLEI for water CLEI = Qe*0.50*∑ [WLLi*exp(-(Ln 2/30)*(N-i))] (expressed in µg) CLEI for dust CLEI = Qe*0.30*DLL*∑ [exp(-(Ln 2/30)*(N-i))] (expressed in µg) Gerard.Ngueta@crchuq.ulaval.ca
INTRODUCTION OBJECTIVES METHODOLOGY RESULTS CONCLUSIONS AND PERSPECTIVES Population Study Samples collection Cumulative exposure variables Overview on Statistical analysis G mt • Statisticalanalysis To estimate the effects of both CLEI and cross-sectional measures of water lead and residential dust lead on BLL in children aged 1 to 5. Linear regression Ordinary least square evaluation Effect estimates Standardized partial regression coefficients Independent contribution of each exposure Gerard.Ngueta@crchuq.ulaval.ca
INTRODUCTION OBJECTIVES METHODOLOGY RESULTS CONCLUSIONS AND PERSPECTIVES Population Study Samples collection Cumulative exposure variables Overview on Statistical analysis G mt • Statisticalanalysis To assess the association between both measures of exposure and the likelihood of BLL greater or equal to 2 µg/dl. Logistic regression Maximum-likelihood estimation Effect estimates Gerard.Ngueta@crchuq.ulaval.ca
INTRODUCTION OBJECTIVES METHODOLOGY RESULTS CONCLUSIONS AND PERSPECTIVES Unadjusted linear effects Adjusted CLEI effects Adjusted Cross-sectional effects Likelihood of BLL ≥ 2 µg/dL G mt • Unadjustedlineareffects of environmental lead on BLL 1) R-Squares obtained with CLEI were greater than those by modeling cross-sectional exposure. Gerard.Ngueta@crchuq.ulaval.ca
INTRODUCTION OBJECTIVES METHODOLOGY RESULTS CONCLUSIONS AND PERSPECTIVES Unadjusted linear effects Adjusted CLEI effects Adjusted Cross-sectional effects Likelihood of BLL ≥ 2 µg/dL G mt • Unadjustedlineareffects of environmental lead on BLL 2) Low values of R-squares (<9%) indicate that an exposure source taking alone is not enough to explain the variability observed in the log(BLL). Gerard.Ngueta@crchuq.ulaval.ca
INTRODUCTION OBJECTIVES METHODOLOGY RESULTS CONCLUSIONS AND PERSPECTIVES Unadjusted linear effects Adjusted CLEI effects Adjusted Cross-sectional effects Likelihood of BLL ≥ 2 µg/dL G mt • Unadjustedlineareffects of environmental lead on BLL 3) Significant crude association between Log(BLL) and Water lead, Windowsill dust loading and Floor dust loading Gerard.Ngueta@crchuq.ulaval.ca
INTRODUCTION OBJECTIVES METHODOLOGY RESULTS CONCLUSIONS AND PERSPECTIVES Unadjusted linear effects Adjusted CLEI effects Adjusted Cross-sectional effects Likelihood of BLL ≥ 2 µg/dL G mt • Adjustedlineareffects of CLEI on BLL 1) Water lead and windowsill dust remain markedly associated with Log(BLL) (β=0.0758, p=0.0002 and β=0.0002, p=0.0058 respectively). Gerard.Ngueta@crchuq.ulaval.ca
INTRODUCTION OBJECTIVES METHODOLOGY RESULTS CONCLUSIONS AND PERSPECTIVES Unadjusted linear effects Adjusted CLEI effects Adjusted Cross-sectional effects Likelihood of BLL ≥ 2 µg/dL G mt • Adjustedlineareffects of CLEI on BLL 2) paint-lead effect was also strongly significant in children exposed to paint chips with high lead level (paint chips ≥ 5000 mg/kg) compared with those living in homes without paint chips and low lead level in painted surface (XRF < 1 mg/cm2). Gerard.Ngueta@crchuq.ulaval.ca
INTRODUCTION OBJECTIVES METHODOLOGY RESULTS CONCLUSIONS AND PERSPECTIVES Unadjusted linear effects Adjusted CLEI effects Adjusted Cross-sectional effects Likelihood of BLL ≥ 2 µg/dL G mt • Adjustedlineareffects of cross-sectionalexposureon BLL 1) Water lead effect was no longer statistically significant (β=0.0106, p=0.0884). Gerard.Ngueta@crchuq.ulaval.ca
INTRODUCTION OBJECTIVES METHODOLOGY RESULTS CONCLUSIONS AND PERSPECTIVES Unadjusted linear effects Adjusted CLEI effects Adjusted Cross-sectional effects Likelihood of BLL ≥ 2 µg/dL G mt • Adjustedlineareffects of cross-sectionalexposureon BLL 2) Adjusted R-square remains low by modeling cross-sectional exposure (0.1557 versus 0.2115 for CELI) . Gerard.Ngueta@crchuq.ulaval.ca
INTRODUCTION OBJECTIVES METHODOLOGY RESULTS CONCLUSIONS AND PERSPECTIVES Unadjusted linear effects Adjusted CLEI effects Adjusted Cross-sectional effects Likelihood of BLL ≥ 2 µg/dL G mt • Association betweenCLEI (worst scenario) and BLL ≥ 2 µg/dl Gerard.Ngueta@crchuq.ulaval.ca
INTRODUCTION OBJECTIVES METHODOLOGY RESULTS CONCLUSIONS AND PERSPECTIVES Unadjusted linear effects Adjusted CLEI effects Adjusted Cross-sectional effects Likelihood of BLL ≥ 2 µg/dL G mt • Association betweenCLEI (worst scenario) and BLL ≥ 2 µg/dl Gerard.Ngueta@crchuq.ulaval.ca
INTRODUCTION OBJECTIVES METHODOLOGY RESULTS CONCLUSIONS AND PERSPECTIVES Unadjusted linear effects Adjusted CLEI effects Adjusted Cross-sectional effects Likelihood of BLL ≥ 2 µg/dL G mt • Association betweenCLEI (worst scenario) and BLL ≥ 2 µg/dl Gerard.Ngueta@crchuq.ulaval.ca
INTRODUCTION OBJECTIVES METHODOLOGY RESULTS CONCLUSIONS AND PERSPECTIVES Unadjusted linear effects Adjusted CLEI effects Adjusted Cross-sectional effects Likelihood of BLL ≥ 2 µg/dL G mt • Association betweenCLEI (worst scenario) and BLL ≥ 2 µg/dl Gerard.Ngueta@crchuq.ulaval.ca
INTRODUCTION OBJECTIVES METHODOLOGY RESULTS CONCLUSIONS AND PERSPECTIVES Unadjusted linear effects Adjusted CLEI effects Adjusted Cross-sectional effects Likelihood of BLL ≥ 2 µg/dL G mt • Association betweenCS (worst scenario) and BLL ≥ 2 µg/dl Gerard.Ngueta@crchuq.ulaval.ca
INTRODUCTION OBJECTIVES METHODOLOGY RESULTS CONCLUSIONS & PERSPECTIVES G mt • In the absence of cohortstudies or Bone lead measures, cumulative lead exposure index is more appropriatethan cross-sectionalmeasures to estimate the association between lead exposure and Blood lead • In youngchildren (agedunder 6) included in thisstudy: If all otherfactors are kept stables, then for eachadditionalincrease in watercumulative exposure, BLL isexpected to increase 1.08 µg/dl (p=0.0002). If all otherfactors are kept stables, then for eachadditionalincrease in cumulative exposure of windowsilldustloading, BLL isexpected to increase 1.00 µg/dl (p=0.0058). Gerard.Ngueta@crchuq.ulaval.ca
INTRODUCTION OBJECTIVES METHODOLOGY RESULTS CONCLUSIONS & PERSPECTIVES G mt • In the absence of cohortstudies or Bone lead measures, cumulative lead exposure index is more appropriatethancroiss-sectionalmeasures to estimate the association between lead exposure and Blood lead • In youngchildren (agedunder 6) included in thisstudy: The mean BLL in children exposed to paint chips with high lead level (paint chips ≥ 5000 mg/kg) is 1.32 µg/dl higher than mean BLL observed in those living in homes without paint chips and low lead level in painted surface (XRF < 1 mg/cm2) Gerard.Ngueta@crchuq.ulaval.ca
INTRODUCTION OBJECTIVES METHODOLOGY RESULTS CONCLUSIONS & PERSPECTIVES G mt • In the absence of cohortstudies or Bone lead measures, cumulative lead exposure index is more appropriatethancroiss-sectionalmeasures to estimate the association between lead exposure and Blood lead • In youngchildren (agedunder 6) included in thisstudy: 1 unit of change in Cumulative floor dust loading does not markedly influence the BLL…However, floor dust loading is significantly associated with the odds of BLL ≥ 2 µg/dl from 8.12 µg/kg of body weight Gerard.Ngueta@crchuq.ulaval.ca
INTRODUCTION OBJECTIVES METHODOLOGY RESULTS CONCLUSIONS & PERSPECTIVES G mt • In the absence of cohortstudies or Bone lead measures, cumulative lead exposure index is more appropriatethancroiss-sectionalmeasures to estimate the association between lead exposure and Blood lead • In youngchildren (agedunder 6) included in thisstudy: The odds of BLL ≥ 2 µg/dl is 4 times higher in children with water cumulative lead ≥ 2.92 µg/kg of bw when compared with those with water cumulative lead < 1.12 µg/kg of bw In the children under the present study, water lead is the first largest contributor to BLL, followed by paint-lead and windowsill dust loading. Gerard.Ngueta@crchuq.ulaval.ca
INTRODUCTION OBJECTIVES METHODOLOGY RESULTS CONCLUSIONS & PERSPECTIVES G mt • Future challenges : Compare resultsobtainedfrom cross-sectionalmeasures of exposurewiththosereported in previousstudies Translate cumulative lead exposure index in terms of public healthlanguages (recommendations) Assess the departurefromodds-ratio multiplicativity (and additivity) thatmaybe due to nutritionalfactors , children’scharacteristics and/or guardian’ssocioeconomic position. Gerard.Ngueta@crchuq.ulaval.ca
G mt • Acknowledgment: Canadian Water Network Ministry of Environment and sustainabledevelopment (MDDEP) Canada Health Gerard.Ngueta@crchuq.ulaval.ca
G mt Research Team: Patrick Levallois Julie St-Laurent Denis Gauvin MarilèneCourteau Michèle Prévost SchokoufehNour France Lemieux Monique D’Armour Pat Rasmussen CelineCampagna EliseDeshommes Suzanne Gingras Alain LeBlanc Annick Trudelle Gerard.Ngueta@crchuq.ulaval.ca
THANK YOU ! Gerard.Ngueta@crchuq.ulaval.ca
G mt • In the databasewereceived, Paint lead was a categorical variable : Gerard.Ngueta@crchuq.ulaval.ca
G mt • Descriptive analysis of EnvironmentalExposure Gerard.Ngueta@crchuq.ulaval.ca