Download
1 / 27
270 likes | 413 Vues
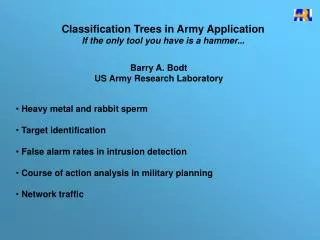
Classification Trees in Army Application If the only tool you have is a hammer. Barry A. Bodt US Army Research Laboratory. Heavy metal and rabbit sperm Target identification False alarm rates in intrusion detection Course of action analysis in military planning Network traffic.

E N D
Classification Trees in Army Application If the only tool you have is a hammer... Barry A. Bodt US Army Research Laboratory • Heavy metal and rabbit sperm • Target identification • False alarm rates in intrusion detection • Course of action analysis in military planning • Network traffic
Heavy Metal and Rabbit Sperm Background • Key Points • Observed that males in contact with heavy metals (e.g., lead) hadlow fertility rates • Low fertility rate was not associated with the percent motile sperm • Independently found that capacitation (ability to fertilize) of sperm, unobservable, was related to an observable termed hyperactivated motility • Conjectured that while heavy metals did not necessarily kill spermthey might prevent hyperactivated motility associated with capacitation • Why did the Army care? 1) soldier exposure, 2)biomarkers
Data Collection • Computer assisted videomicrography • Track rabbit sperm cells at 30 frames/sec • Solution preparation conditions consistent with hyperactivated cells(322) and hyperactivated cells (899) • For individual cell motion, tracked straight line velocity (VST), curvilinear velocity (VC) [um/sec], average amplitude of lateral headdisplacement (AALH)[um], beat cross frequency (BCF), Wob, etc. • Wobble (Wob) was the ratio of the average path velocity (VAP) (7 frame smooth) to the VC (piecewise path computation). Avr Path Path
Classification Results WOB 1.0 0.8 0.6 0.4 0.2 0.0 DiscriminantModel 2 H 864 N 21 H 9 N 0 H 14 N 299 H 3 N 0 H 9 N CART H - hyperactivated N - non-hyperactivated 0 50 100 150 200 250 300 350 VC Note: used Systat Cart add-on module and FACT
Effect of Pb on Sperm Motility Percent Motile Hyperactivated Percent Motile 80 80 PMH PM 0 0 Time Time Concentration Concentration
Target Identification Background Key Points • Goal: Broadly to identify certain targets based on acoustic and seismic featuresSpecifically to uncover a minimal set of features that maximally separate targets • Past Work: Simple power spectral estimates Back-propagation neural network • Approach: Focus on features … peek inside the “black box”
Data Collection • Four vehicles • 2 runs for each vehicle on a predetermined far-near-far path • 1 run consists of approximately 125 contiguous 1-second windows • 1,041 windows were analyzed • 11-valued acoustic feature vector for each 1-second window • 4 seismic features for each 1-second window … first four central moments • Data were separated into learning and test samples in the ratios 9:1,8:2, 7:3, 6:4.
Exploratory Data Analysis Box Plot Summaries Box Plot of H3 by Group Box Plot of H6 by Group
Exploratory Data Analysis Scatter Plot Summaries Scatter Plot of H3 vs H7 Scatter Plot of H4 vs H7
Classification and Regression Trees Models Model Development CART Tree (Default) Based on the 9:1 Learning Sample Group 1 ( 82.0 % )Group 2 ( 77.7 % )Group 3 ( 71.9 % ) Group 4 ( 80.8 % ) Note: used Statistica Cart and Quest
CART Tree (Depth = 3) Based on the 9:1 Learning Sample Test Sample Results Group 1 ( 68.8 % )Group 2 ( 70.8 % )Group 3 ( 87.5 % ) Group 4 ( 83.3 % )
Model Sensitivity CART Tree (Depth = 3) Based on the 8:2 Learning Sample Test Sample Results 8:2 7:3 6:4 Group 1 | 78.6 % 64.7% 70.9%Group 2 | 51.2 % 62.1% 57.7%Group 3 | 80.3 % 76.2% 78.6% Group 4 | 79.1 % 81.8% 78.3%
Discriminant Analysis Model Development Scatter Plot of Discriminant Roots for 9:1 Test Sample
False Alarm Rate in Intrusion Detection Background • Key Points • Purpose: to develop a filter to reduce the false alarm rate • Network intrusion is a big concern; many safeguards are imposed • JIDS from LLNL yields one-hour snapshots of user activity and network response • Weigh activity against hits on a flag file of strings associatedwith intrusion (e.g., “Permission denied”, “Hosing Trusted Host”) • Alerts are generated when threshold counts are exceeded for flagfile entries. A severity index is also considered. • Investigate alerts in light of user log; many false alarms; need automated “collective” interpretation of strings
Data Collection • Data gathered at ARL over a past year had 940 alerts • Network administrator classified user activity as legitimate (644),attempted break-in (285), successful break-in (11) • C-program preprocessed activity log creating 259 columnsaugmented with 1 user-intent column x 940 rows • Cells are frequencies of jth string in ith alarm • Dimensionality and a sparse matrix pose a challenge • Preliminary screen for useful features using SPSS discriminant analysis; Statistica CART would not allow the 260 columns • Completed analysis with CART and Quest in Statistica
Observed User Intent Percent Correctly Classified Predicted User Intent Successful Break-in Attempted Break-in Legitimate Activity Successful Break-in 90.9 10 0 1 Attempted Break-in 100 0 285 0 Legitimate Activity 92.7 8 39 597 Classification Results
Course of Action (COA) Background • Key Points • COA Goals • accomplish the mission • while positioning the force • to retain initiative for future operations • Importance of battlefield metrics (during battle) to decisions inlight of COA goals • High fidelity simulation, One Semi Automated Forces (OneSAF) • Study purpose: to uncover patterns in the data relating early battlefield conditions to ultimate battle outcome, thereby providing support for battlefield metrics
Battle Scenario BMP-2 BMP-2 BMP-2 T-72M T-80 T-72M Town T-72M T-72M T-80 T-72M T-80 T-80 Company Objective
Data Collection • Scenario runs require direct oversight and take 30 - 90 minutes;preprocessing requires an additional 1 hour on average • A variety of machines are used including SGI Octane2, SGI OnyxHPC Sun 1000s, Sun UltraSparc 60 • Killer-victim scoreboard utility for OneSAF was developed toextract detailed battlefield information • Data matrix is (4 responses+ 429 measures [distributed over 3 time slices] + 1 time stamp + 1 machine ID) x 231 battles (25 available) • Time-slice stopping times linked to blue munition use 10%, 25%, 45%. • Example Measures • number of 125 HEAT taken by Platoon 1 by time 1 • damage level of Platoon 1 by time 2 • number of 105 SABOT hits by Platoon 3 on T80 by time 1
Network Traffic and Computer Security Future Work • Key Points • User activity profiles • 350 MB of synthesized network traffic data • Classfication trees will have a role
References R.J. Young, B.A. Bodt, Development of Computer Directed Methods for the Identificationof Hyperactivated Motion Using Motion Patterns Developed by Rabbit Sperm During Incubation Under Capacitation Conditions, Journal of Andrology, 15: 362-377, July, 1994. R.J. Young, B.A. Bodt, D.H. Heitkamp, The Action of Metallic Ions on the PrecociousDevelopment by Rabbit Sperm of Motion Patterns that are Characteristic of Hyperactivated Motility, Molecular Reproduction and Development, 41: 239-248, June, 1995. B.A. Bodt, An Analysis of the Discriminating Utility of Acoustic and Seismic Signatures for a Vehicle Classification Example, ARL-TR-1874, January 1999. L. Eggen, B. Bodt, H. Kash, C. Hansen, "Reducing the False Alarm Rate in Information Assurance," ARL-TR-2348, July, 2001. Bodt, B. et al., “Pursuit of New Battlefield Metrics through Simulation and Statistical Modeling,”70th Military Operations Research Society Symposium, June, 2002.