Intersection Safety Implementation Plan Workshop

Intersection Safety Implementation Plan Workshop
E N D
Presentation Transcript
Note to the Reader: All text in red shows example information and data that corresponding with information and data in the companion example Data Analysis Package and Straw Man Outline and/or the Example Intersection Safety Implementation Plan. This data/information should be replaced for use in your State. Intersection Safety Implementation PlanWorkshop January 21-22, 2009 Example Presentation
Workshop Goals and Objectives • Examine the comprehensive and systematic approaches to reducing statewide intersection fatalities • Identify sets of acceptable countermeasures and deployment characteristics that can reduce statewide intersection fatalities cost effectively and achieve the intersection safety goal • Develop a preliminary strategic implementation or action plan to reduce statewide intersection fatalities cost effectively • Identify strategic directions and steps needed to successfully implement the plan
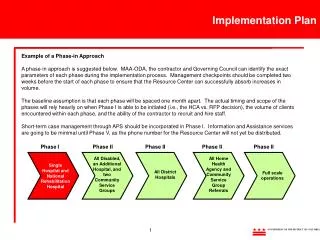
Workshop Outcome Preliminary Intersection Safety Implementation Plan to Reduce Statewide Intersection Fatalities Cost Effectively
Morning Agenda – Day 1 • 8:30 AM - Welcome and Introductions • Review of Workshop Goals, Objectives, and Outcome • Background on Reducing Intersection Safety Fatalities • 8:45 AM - Module I: Intersection Goal, Data Analysis, and Countermeasure Identification • 10:00 AM - Break • 10:15 AM - Module I Continued • 12:00 PM - Lunch
Afternoon Agenda – Day 1 • 1:00 PM - Module II: Putting It All Together • 2:45 PM - Break • 3:00 PM - Module II Continued • Straw Man Set of Countermeasures, Deployment Characteristics, Costs, and Lives Saved • 4:30 PM - Adjourn
Morning Agenda – Day 2 • 8:30 AM - Module II Reality Check • Review Day 1 results • Review and fine tune straw man • Check personal knowledge of high-crash intersections to determine if improvement types make sense • 9:45 AM - Break • 10:00 AM - Module III: Strategic Direction and Actions • Crosscutting barriers • Key countermeasure barriers • 12:00 PM - Lunch
Afternoon Agenda – Day 2 • 1:00 PM - Module III: Strategic Direction and Actions (continued) • 2:00 PM - Module IV: Action Items to Implement Components of Implementation Plan Outline • Key steps to implement countermeasures • Performance measures • Implementation plan outline • 3:00 PM - Module V: Next Steps • 3:15 PM - Adjourn
Reducing Intersection Fatalities • Traditional Approach • Annual infrastructure improvements of 50-75 high-crash intersections statewide • Cost-effective but minimal statewide impact • Systematic Approach • Improve substantial number of targeted intersections which have severe crashes with relatively low to moderate cost improvements • Rely on low-cost, cost-effective countermeasures • Improve 3-6% of intersections that have 25-45% of the statewide intersection crashes • Higher overall cost but greater impact in terms of statewide levels of lives saved • Comprehensive Approach • Complement infrastructure improvements with targeted enforcement and education initiatives • 3E (engineering, education, and enforcement) coordinated initiatives on highway corridors and municipalities that have high numbers of intersection injuries and fatalities
Traditional Approach Improvement Categories • High-crash intersections • Very high number of crashes per intersection (> 50 crashes in 5 years for rural intersections; 100 crashes per intersection for urban areas) • Application of countermeasures with highest CRFs (e.g., roundabouts, left turn lanes) • Unfortunately, these also are the highest cost • Individual intersection analyses required • Few improvements • Usually less than 100 per year • By itself, negligible impact on reducing statewide fatalities
Systematic Approach • Reverse of the traditional approach • Start with effective, low-cost countermeasures • Find intersections with targeted crashes where countermeasures are cost-effective to install • Install systematically at numerous intersections where they are cost-effective • Not limited to the highest crash locations • Typically, treating 3-6% of the higher crash intersections can impact 25-45% of the statewide problem • Systematic approach can reduce statewide fatalities
Systematic Improvement Characteristics • Signalized and stop-controlled • Urban and rural • State and local • Low-cost, cost-effective countermeasures • Numerous widespread, cost-effective deployments
Comprehensive Approach • Corridor Improvements • Routes that have a very high number of intersection fatalities and severe injuries • Engineering, education, and enforcement coordinated corridor-wide enforcement • Area-Wide 3E Improvements • City-wide, system approach in cities with a disproportionate number of fatal or severe intersection crashes per capita or VMT • Engineering, education, and enforcement coordinated area-wide enforcement
Module I:Intersection Goals, Data Analysis, and Countermeasure Identification
Module I Activities • Review the goals and/or objectives for intersections identified in the Strategic Highway Safety Plan (SHSP) • Discuss the results of intersection crash data analysis • Review acceptable potential countermeasures to impact crash problems
Module I Outcomes • Validation of State goals and objectives as they relate to intersections • Better understanding of intersection crash characteristics particularly as they relate to intersection goals • Identification of acceptable potential countermeasures to consider for cost-effective deployment to help achieve the goal
State Safety Goal • Strategic Highway Safety Program Overall Goal • 850 or fewer fatalities by 2012 • 992 in 2008 • Probable lower fatalities in 2009 associated with the economy • 14.3% reduction in fatalities (2008-2012) • Economic downturn/upturn affects fatalities • By 2012, economy could be on upswing and have a negative impact on fatalities
Intersection Safety Goal • 2003-2008 intersection fatalities – 214; 184; 187; 210; 187; 200 – no apparent trend • Mean intersection fatalities – 197 • 14.3% reduction in intersection fatalities (proportional to total fatality reduction goal) • Assumes downswing and upswing of economy between 2008 and 2012 will be neutral • Target reduction in 2012 intersection fatalities = 197 0.143 = 28 fewer intersection fatalities in 2012
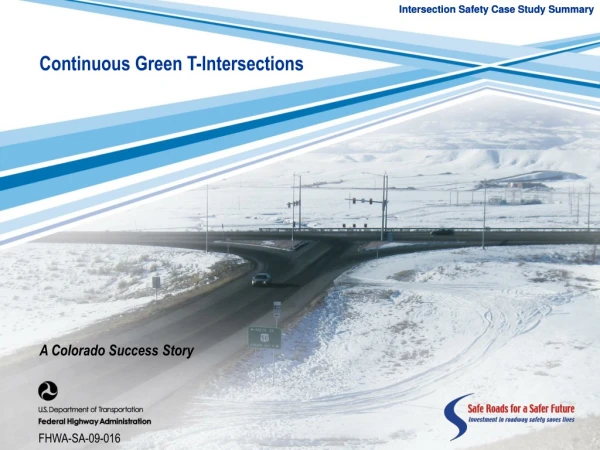
Intersection Safety Emphasis Strategies – SHSP • Engineering • Improve intersection awareness • Install stop-approach rumble strips • Improve signage and intersection visibility • Improve sight distance • Install dynamic flashing beacons • Install or enhance intersection lighting • Implement innovative engineering designs • Install roundabouts • Install J-turns • Add offset turn lanes • Use traffic calming strategies (narrowing lanes)
Intersection Safety Emphasis Strategies – SHSP • Engineering (continued) • Modify signal phasing and timing • Protect left-turn movement • Provide adequate clearance times (ITE guidelines) • Provide dilemma zone protection • Upgrade signal identification to assist officers in enforcing red-light violations • Remove unwarranted signals • Use proper planning and design of access to public roadways • Access management planning
Intersection Safety Emphasis Strategies – SHSP • Education • Educate roadway users on intersection traffic controls (permissive left turn movement with traffic signals) • Enforcement • Increase enforcement of intersection violations (red light running, regulatory signs)
SHSP Basic Phases • Producing the SHSP • Producing the Implementation Plan • Implementation • Evaluation and Updating
Six-Year Fatality Analysis * Fatalities from State data
Intersection Crash Data Analysis See Data Analysis Package and Straw Man Outline
Reducing Intersection FatalitiesCrash Data • Traditional Approach • Annual infrastructure improvements of 50-75 high-crash intersections statewide • Cost-effective but minimal statewide impact • Systematic Approach • Improve substantial number of targeted intersections which have severe crashes with relatively low to moderate cost improvements • Rely on cost-effective countermeasures • Higher overall cost but greater impact in terms of lives saved • Comprehensive Approach • Complement infrastructure improvements with targeted enforcement and education initiatives • 3E (engineering, education, and enforcement) coordinated initiatives on highway corridors and municipalities that have high numbers of intersection injuries and fatalities
Traditional Approach • Usually highest intersection crash locations • If a fatal crash occurred at an intersection in the recent past, it is unlikely that one will occur in the future even if no preventative action is taken
Speed Type of crash Point of Impact Type and mass of involved vehicle(s) Safety belt usage Type of highway Weather and surface conditions Time of day Type of traffic control Crash location – urban or rural Age and health of drivers and occupants EMS capabilities Distance to nearest hospital Other variables Factors that Impact the Difference Between Life and Death in an Intersection Crash
Traditional Approach Improvement Categories • Highest state wide severe crash intersections • Very high number of crashes per intersection (> 50 crashes in 5 years for rural intersections; 100 crashes per intersection for urban areas) • Ideally, application of countermeasures with highest CRFs (e.g., roundabouts, left turn lanes) • Unfortunately, these also are the highest cost • Individual intersection analyses required • Few improvements • Usually between 50 and 75 per year for an average size state • By itself, negligible impact on reducing statewide fatalities
Reducing Intersection FatalitiesCrash Data • Traditional Approach • Annual infrastructure improvements of 50-75 high-crash intersections statewide • Cost-effective but minimal statewide impact • Systematic Approach • Improve substantial number of targeted intersections which have severe crashes with relatively low to moderate cost improvements • Rely on cost-effective countermeasures • Higher overall cost but greater impact in terms of lives saved • Comprehensive Approach • Complement infrastructure improvements with targeted enforcement and education initiatives • 3E (engineering, education, and enforcement) coordinated initiatives on highway corridors and municipalities that have high numbers of intersection injuries and fatalities
Systematic Approach • Reverse of the traditional approach • Start with effective, low-cost countermeasures • Find intersections with targeted crashes from the crash data base where countermeasures are cost-effective to install • Install systematically at numerous intersections where they are cost-effective • Not limited to the highest crash locations • Crash types with higher numbers of fatalities per 100 crashes • Typically, treating 3-6% of the higher crash intersections can impact 25-45% of the statewide problem • Systematic approach can reduce statewide fatalities
Reducing Intersection FatalitiesCrash Data • Traditional Approach • Annual infrastructure improvements of 50-75 high-crash intersections statewide • Cost-effective but minimal statewide impact • Systematic Approach • Improve substantial number of targeted intersections which have severe crashes with relatively low to moderate cost improvements • Rely on cost-effective countermeasures • Higher overall cost but greater impact in terms of lives saved • Comprehensive Approach • Complement infrastructure improvements with targeted enforcement and education initiatives • 3E (engineering, education, and enforcement) coordinated initiatives on highway corridors and municipalities that have high numbers of intersection injuries and fatalities
Comprehensive Approach • Corridor intersection safety • Targeted municipal enforcement and education
Comprehensive ApproachCorridors See Data Analysis Package and Straw Man Outline
Comprehensive ApproachMunicipalities See Data Analysis Package and Straw Man Outline
Applicable Countermeasures • Systematic Approach – Stop-Controlled Intersections • Basic set of sign and marking improvements • Either a) flashing solar powered LED beacons on advance intersection warning signs and STOP signs or b) flashing overhead intersection beacons • J-turn modifications on high-speed divided arterials • Systematic Approach – Signalized Intersections • Basic set of signal and sign improvement • Change of permitted and protected left-turn phase to protected-only • Advance detection control systems • Pedestrian countdown signals • Separate pedestrian phasing • Pedestrian ladder or cross-hatched crosswalk and advanced pedestrian warning signs • Systematic Approach – Both Stop-Controlled and Signalized Intersections • New or upgraded lighting • High-friction surface • Comprehensive Approach • Corridor 3E improvements on high-speed arterials with very high frequencies of severe intersection crashes • Municipal-wide 3E improvements in municipalities with high frequencies of severe intersection crashes • Enforcement-assisted lights • Traditional Approach • Roundabouts
Countermeasures for Systematic Deployment – Stop-Controlled Intersections • Basic Set of Sign and Marking Improvements • Supplemental Enhancements
Stop-Controlled Intersections – Basic Set of Sign and Marking Improvements • Low-Cost Countermeasures for the Through Approach • Doubled-up (left and right), oversize advance intersection warning signs, with street name sign plaques • Low-Cost Countermeasures for the Stop Approach • Doubled-up (left and right), oversize advance “Stop Ahead” intersection warning signs • Doubled-up (left and right), oversize STOP signs • Installation of a minimum 6 foot wide raised splitter island on the stop approach (if no pavement widening is required) • Properly placed stop bar • Removal of any foliage or parking that limits sight distance • Double arrow warning sign at stem of T-intersections • Small, 6 foot splitter island
Stop-Controlled Intersections – Basic Set of Sign and Marking Improvements
Example of an Installation of a Minimum 6 Foot Wide Raised Splitter Island on the Stop Approach (No Pavement Widening Required)
Stop-Controlled Intersections – Supplemental Enhancements • Installation of a 6 ft. or greater raised divider on stop approach (installed separately as a supplemental countermeasure) • See FHWA-HRT-08-063 for further design and performance information • Flashing beacons • Solar powered LED beacons on advance intersection warning signs and STOP signs, or • Overhead intersection beacons • Dynamic warning sign which advises through traffic that a stopped vehicle is at the intersection and may enter the intersection • Transverse rumble strips across the stop approach lanes • In rural areas where noise is not a concern and running STOP signs is a problem • “Stop Ahead” pavement marking legend if noise is a concern
Stop-Controlled Intersections – Supplemental Enhancements (continued) • Dynamic warning sign on the stop approach to advise high-speed approach traffic that a stopped condition is ahead • Use when vehicles running the “Stop” sign is a problem • Extension of the through edge line using short skip pattern • May assist drivers to stop at the optimum point • Used on intersections with very wide throats in which stopped drivers have difficulty stopping at the correct location • Reflective stripes on sign posts • Use on signs with degraded conspicuity due to sign clutter or competing background features to increase attention to the sign, particularly at night