Download
1 / 2
20 likes | 139 Vues
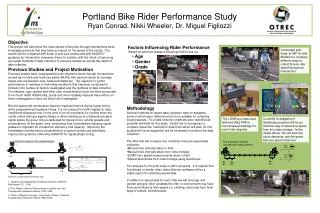
This project aims to determine the mean speed of bicycles at various downtown Portland intersections while assessing factors influencing rider performance, such as age, gender, and road grade. By comparing the results with prior studies and guidelines from AASHTO, we hope to enhance data collection methods and improve bicycle clearance time at traffic signals. Our study involves a pilot test using four different speed measurement techniques, including manual timing and LIDAR technology, to analyze cyclists’ performance effectively.

E N D
Distance interval time measurement t1 t2 x=0 x=d tf tacceleration x=dt x=0 x=da Distance traveled accelerating from stop More dynamic velocity, acceleration measurement What criteria does this intersection meet: *Flat *High level of bike traffic *On comuter route *Various ages (predomenanty 18-65)… *Located in downtown Portland Intersection Site 1 example: Something Flat…. Intersection Site 2 example: Something Hilly… What criteria does this intersection meet *Hill *High level of bike traffic *On comuter route *Various ages (predomenanty 18-65)… *Located in downtown Portland Google Map with Locations shown??—Mark points and lable Δxn, Δtn Δx2, Δt2 Δx1, Δt1 Portland Bike Rider Performance StudyRyan Conrad, Nikki Wheeler, Dr. Miguel Figliozzi Empirical Comparison of German and U.S. Traffic Sensor Data and Impact on Driver Assistance Systems Steven Hansen and Dr. Robert L. Bertini, Portland State University www.its.pdx.edu Objective This project will determine the mean speed of bicycles through intersections while investigating factors that may have an impact on the speed of the cyclist. The results will be compared with those of previous studies and with AASHTO1 guidance for intersection clearance times for cyclists, with the intent of improving upon past methods of data collection in previous studies as well as the depth of data collected. • Factors Influencing Rider Performance • Based on previous research this project will focus on: • Age • Gender • Grade Conducted pilot study at SW 1st and Madison to compare different ways to collect bicycle rider speed through an intersection. Previous Studies and Project Motivation Previous studies have investigated bicycle clearance times through intersections as well as on trails and multi-use paths (MUPs) with derived values for average speed and acceleration over measured distances. The research in cyclist performance in roadway or trail-riding conditions that has been conducted is limited in the number of factors investigated and the methods of data collection. For instance, age, gender and other rider characteristics have not been accounted for in much detail. Additionally, grade and other roadway features have either not been investigated or have not been fully investigated. Bicycle speed and acceleration become important factors during signal timing when programming the phase timing. It is not unusual for traffic signals to have insufficient clearance time (in the form of an all-red phase) for cyclists when the cyclist enters during a signal change or when starting up at a demand-actuated signal where the green time is calibrated for typical motor vehicle speeds and accelerations. At the same time, minimizing time lost between changing signal phases is important for intersection efficiency and capacity. Improving the knowledge of performance characteristics of typical cyclists can potentially improve the guidance offered by AASHTO for signal phase timing. Steve Hansen, Dr. Robert Bertini, Portland State University • Methodology • Several methods for speed data collection were investigated, some of which were determined not to be suitable for collecting bicycle speeds. Four data collection methods were identified as potential methods for this study. A pilot test is in progress to compare these four methods to determine which will work for this study and if more equipment will be necessary to perform the data collection. • The Pilot test will compare four methods of bicycle speed data collection: • Manual time intervals taken in field • Manual time intervals taken from video footage • LIDAR Gun speed measurements taken in field • Speed determined from video footage using AutoScope • The analysis for the pilot study is still in progress. It is hopeful that AutoScope or similar video data collection software will be a viable option for collecting speed data. • In addition to speed data for each rider we will note age and gender and any other variables the rider or environment may have that could influence their speed (i.e. clothing, extra load from book bags or trailers, attentiveness). The LIDAR gun was used with and iPaq PDA to record speed readings for each rider targeted. Currently investigating if AutoScope program will be an effective way to determine speed from the video footage. In the image above, the red bars are count detectors, and the green bars are speed detectors. 1. Guide for the Development of Bicycle Facilities. AASHTO, Washington D.C., 1991. 2. Pein, Wayne. Bicyclist Performance on a Multi-use Trail. Transportation Research Record 1578, 1995. 3. Times of Bicycle Crossings: Case Study of Davis, California, Transportation Research Record 1939, 2006. www.its.pdx.edu
Distance interval time measurement t1 t2 x=0 x=d tf tacceleration x=dt x=0 x=da Distance traveled accelerating from stop More dynamic velocity, acceleration measurement Δxn, Δtn Δx2, Δt2 Δx1, Δt1