Download
1 / 11
110 likes | 397 Vues
Class 20. Hightower Department Store. Introduction to Regression. What we will cover today. What is a regression line? What are two ways to find the equation of a simple linear regression line (if you have data)? What gets regressed on what and why?

E N D
Class 20. Hightower Department Store Introduction to Regression
What we will cover today • What is a regression line? • What are two ways to find the equation of a simple linear regression line (if you have data)? • What gets regressed on what and why? • How to use the regression line to construct a point forecast? • What additional assumptions/information do we need to make a probability forecast?
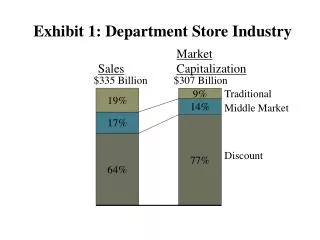
Case Facts • Chain of 16 US department stores • In Late January, Julia Brown went to Germany to select and order stuffed animals to be sold in Hightower Department Stores during the Holiday season. • For “borderline” animals, Brown ordered a limited quantity, offered them for sale in only one store, and used/not used them the following year based on how they tested.
2011 Test Animals Leftover units are sold to TJMaxx for 80% of landed cost. Which animal(s) should she “adopt” for 2012? If adopted, how many units will be sold?
Past Test Results The challenge: Use test sales to predict Actual Sales. 2003 Rabbit and 2007 Skunk. What to do with them?
Let’s go to Excel What we do will be posted….
Regression..the tool to use to draw a line through a cloud of points • We regress Actual Sales on Test Sales • The regression line is the line that minimizes sum of squared errors. • Error = Actual – Predicted • Predicted is the prediction from the regression line. • Data Analysis, Regression gives us the equation of the regression line….and much more. • You can also get the equation of the regression line by right clicking on the chart. There is only one line that minimizes SSE
To Use the regression line to make a point forecast… • Just plug the known X-value (here X is test sales) into the equation of the regression line. • Point forecast for the bear which had test sales of 10 units is…… = 68.088 + 12.398*10 = 192.1 units. Under certain assumptions…this is the mean of Y PredictedY Point forecast
What we covered today • What is a regression line? • What are two ways to find the equation of a simple linear regression line (if you have data)? • What gets regressed on what and why? • How to use the regression line to construct a point forecast? • What additional assumptions/information do we need to make a probability forecast?
Assignment 22 • No class Monday (no Sunday office hours) • Assignment 22 due Wed (Tuesday evening office hours) • Assignments are 35% of course grade (more than any exam). Drop lowest two. • Happy Easter….safe travels.