Download
1 / 1
10 likes | 165 Vues
ICA-based Clustering of Genes from Microarray Expression Data Su-In Lee 1 , Serafim Batzoglou 2 silee@stanford.ed, serafim@cs.stanford.edu 1 Department of Electrical Engineering, 2 Department of Computer Science, Stanford University. Ribosome Biosynthesis.

E N D
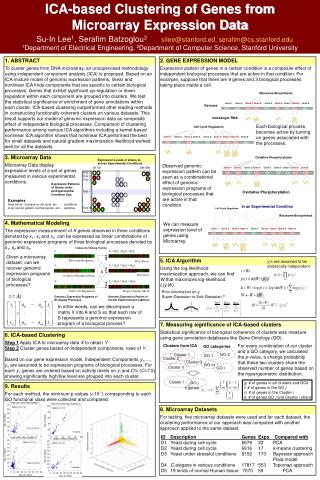
ICA-based Clustering of Genes from Microarray Expression Data Su-In Lee1, Serafim Batzoglou2silee@stanford.ed, serafim@cs.stanford.edu 1Department of Electrical Engineering, 2Department of Computer Science, Stanford University Ribosome Biosynthesis Gene 1 Gene 2 Gene 3 Gene 4 Gene 5 Gene 6 Gene 7 Gene 8 Gene 9 Oxidative Phosphorylation Gene 1Gene 2 Gene 3 Gene 4 Gene 5 Gene 6 Gene 7 Gene 8 Gene 9 Cell Cycle Regulation Gene 1 Gene 2 Gene 3 Gene 4 Gene 5 Gene 6 Gene 7 Gene 8 Gene 9 Oxidative Phosphorylation In an Experimental Condition Cell Cycle Regulation Ribosome Biosynthesis Gene 1 Gene 2 Gene 3 Gene 4 Gene 5 Gene 6 Gene 7 Gene 8 Gene 9 Unknown Mixing System Ribosome Biogenesis Heat Shock Starvation Oxidative Phosphorylation Cell Cycle Regulation Hyper-Osmotic Shock Genomic Expression Programs of Biological Processes Genomic Expression Pattern in Certain Experimental Conditions GO 2 GO 1 GO m GO i Cluster i GO j k genes g: # of genes in all clusters and GOs f: # of genes in the GO j n: # of genes in the Cluster i k: # of genes GO j and Cluster i share 1. ABSTRACT To cluster genes from DNA microarray, an unsupervised methodology using independent component analysis (ICA) is proposed. Based on an ICA mixture model of genomic expression patterns, linear and nonlinear ICA finds components that are specific to certain biological processes. Genes that exhibit significant up-regulation or down-regulation within each component are grouped into clusters. We test the statistical significance of enrichment of gene annotations within each cluster. ICA-based clustering outperformed other leading methods in constructing functionally coherent clusters on various datasets. This result supports our model of genomic expression data as composite effect of independent biological processes. Comparison of clustering performance among various ICA algorithms including a kernel-based nonlinear ICA algorithm shows that nonlinear ICA performed the best for small datasets and natural-gradient maximization-likelihood worked well for all the datasets. 2. GENE EXPRESSION MODEL Expression pattern of genes in a certain condition is a composite effect of independent biological processes that are active in that condition. For example, suppose that there are 9 genes and 3 biological processes taking place inside a cell. Genome messenger RNA Each biological process becomes active by turning on genes associated with the processes. 3. Microarray Data Microarray Data display expression levels of a set of genes measured in various experimental conditions. Expression Levels of aGene Gi across Experimental Conditions Observed genomic expression pattern can be seen as a combinational effect of genomic expression programs of biological processes that are active in that condition. G1 G2GN-1GN Exp 1 Exp 2 Exp 3 Expi Expression Patterns of Genes under an Experimental Condition Expi Examples Heat shock, G phase in cell cycle, etc … conditions Liver cancer patient, normal person, etc … samples Exp M 4. Mathematical Modeling The expression measurement of K genes observed in three conditions denoted by x1, x2 and x3 can be expressed as linear combinations of genomic expression programs of three biological processes denoted by s1, s2 and s3. We can measure expression level of genes using Microarray. Given a microarray dataset, can we recover genomic expression programs of biological processes? 5. ICA Algorithm Using the log-likelihood maximization approach, we can find W that maximizes log-likelihood L(y,W). yi’s are assumed to be statistically independent Prior information on y Super-Gaussian or Sub-Gaussian ? In other words, can we decompose a matrix X into A and S so that each row of S represents a genomic expression program of a biological process? 7. Measuring significance of ICA-based clusters Statistical significance of biological coherence of clusters was measure using gene annotation databases like Gene Ontology (GO). 6. ICA-based Clustering Step 1 Apply ICA to microarray data X to obtain Y Step 2 Cluster genes based on independent components, rows of Y. Based on our gene expression model, Independent Components y1,…, yn are assumed to be expression programs of biological processes. For each yi, genes are ordered based on activity levels on yi and C% (C=7.5) showing significantly high/low level are grouped into each cluster. For every combination of our cluster and a GO category, we calculated the p-value, a change probability that these two clusters share the observed number of genes based on the hypergeometric distribution. Clusters from ICA GO categories Cluster 1 Cluster 2 Cluster 3 Cluster n 9. Results For each method, the minimum p-values (<10-7) corresponding to each GO functional class were collected and compared. 8. Microarray Datasets For testing, five microarray datasets were used and for each dataset, the clustering performance of our approach was compared with another approach applied to the same dataset. ID Description Genes Exps Compared with D1 Yeast during cell cycle 5679 22 PCA D2 Yeast during cell cycle 6616 17 k-means clustering D3 Yeast under stressful conditions 6152 173 Bayesian approach Plaid model D4 C.elegans in various conditions 17817 553 Topomap approach D5 19 kinds of normal Human tissue 7070 59 PCA