Download
1 / 85
850 likes | 1.03k Vues
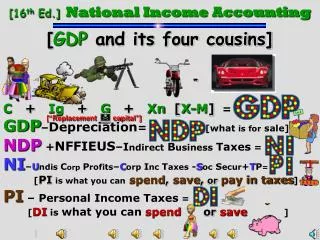
[16 th Ed.] National Income Accounting. [ GDP and its four cousins]. -. C + Ig + G + Xn [ X-M ] = GDP – Depreciation = [what is for sale] NDP + NFFIEUS –I ndirect B usiness Taxes =

E N D
[16th Ed.]National Income Accounting [GDP and its four cousins] - C + Ig + G + Xn [X-M] = GDP–Depreciation= [what is for sale] NDP +NFFIEUS–Indirect Business Taxes = NI–Undis Corp Profits–Corp Inc Taxes -Soc Secur+TP= [PIis what you canspend, save, or pay in taxes] PI – Personal Income Taxes = [DI is what you can spend or save] [“Replacement capital”]
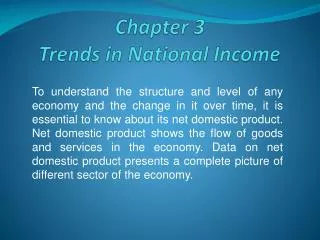
Gross Domestic Product – market value of all final legal output produced in a country in one year. Gross Domestic Product Nominal (money) GDP =$6.00 Year one Nominal GDP measures current output valued at current prices. $2.00 $2.00 $2.00 The base year is the benchmark year to which other years are compared. Nominal (money) GDP =$6.10 Year Two [Recession - decrease in real output] $3.05 $3.05 Real GDP – measures only output. [measures current output at base-year prices ($4), not current prices ($6.10)].
What is the difference between GDP and GNP? [GNP was used until 1991] GDP measures production in the U.S. GNP measures production by Americans.
GDP v. GNP GNP – Ownership All goods/services produced legally for paybycitizens of a country. [Citizenship mattered, not geography] China Europe Nike in Indonesia Plano, TX in Chicago GDP - Location All goods/services produced legally for pay ina country’s borders. [Geography matters, not citizenship] Provo,UT BMW in Waco Honda in Ohio Products born in the USA The difference between GDP & GNP is about 2/10 of 1%.
N.F.F.I. [U.S.A.Profits Overseas] Restof World $220bil. Foreign Profits inU.S.A. $209billion N.F.F.I. = $11 billion If U.S. Profits in the ROW are greater[$220]than foreign profits in the U.S.[$209],add the difference.
N.F.F.I. [U.S.A. Profits Overseas] Rest of World $200bil. Foreign Profits inU.S.A. $209bill. N.F.F.I.E.U.S. = -$9 billion If foreign profits in the U.S. [$209] are greater than U.S. profits in the ROW [$200],subtract the difference.
Can the economy grow too fast? Yes, if there is Full Employment. The speed limit for GDP growth is 4%. But, if the economy is in recession, There is no speed limit for GDP growth.
Economy’s Speed Limitat Full Employmentis4%,instead of2.5%. Can sustain a much greater increase in AD if the AS curve is also shifting to the right, due to increasing productivity. AD2 In the early 90’s, at FE, 2.5% was the speed limit. AS shifted slowly due to low productivity. AD1 AS1 AS2 PL2 PL3 PL1 So, at FE, the“goldilocks economy”has expanded. Increasing productivity of the late 90’s allowed more growth at FE GDP. Y*1 Y2 Y3 Real GDP under 4% 0 Real GDP 17 increases 4% “Goldilocks Economy” [not too fast or slow]
GDP <10 years without a recession> *Represents“GDP Speed Limit”at full employment
Real GDP and the Last Few Recessions Billions of 1996 Dollars $10,000 9,000 8,000 7,000 6,000 5,000 4,000 3,000 1970 1975 1980 1985 1990 1995 2000
Components of Gross Domestic Product [C + Ig + G + X - M]
GDP = C(66%) + Ig(18%) + G(17%) + Xn Expenditures Approach Personal Consumption Expenditure ( C ) • Durable ConsumerGoods[12%] • Nondurables[29%][soup & soap] • Consumer Expenditures for Services[59%] Maytag produced here Spending by HH on all g/s except for new housing. Ferrari produced here
Households As Spenders COMPOSITION OF CONSUMER Spending, 2005 Total of $8,746 billion Services $5,155 billion (59%) Durable Goods $1,027 billion (12%) Nondurable Goods $2,564 billion (29%)
Expenditures Approach Personal Consumption Expenditure ( C ) Let’s say this Porsche is produced by a foreign co. in Plano, Texas. Gross Private Domestic Investment (IG) 3 Subcategories[*spending on output not consumed] A. Businessspending on realcapital- tools, machinery, & plants B. New construction investment – construction of new houses and apartments [can rent for financial return]. C. Unsold inventory investment – change in inventories [Anet increase in inventories isinvestment; a net decrease in inventoriesisnegative investmentor disinvestment(disinvestmentrepresents sale ofoutput produced in a previous year) U.S. capital stock is over $30 trillion.
Expenditures Approach Personal Consumption Expenditure ( C ) Gross Private Domestic Investment ( Ig ) Government Purchases (G) [state, local & federal] [“G” purchases of goods/svcs produced (not transfer payments) 3 Subcategories of Government A. Federal government [40%] B. 50 State governments C. 88,000 local governments [60% for state and local]
Expenditures Approach Personal Consumption Expenditure (C) Gross Private Domestic Investment (Ig) Government Purchases ( G ) Net Exports( Xn) Net Exports (Xn)=Exports (X)–Imports (M) [M represents productionoutside a country]
Government Purchases 18% Net Exports -3 % Investment 16% Consumption 69% GDP and Its Components (2001)
CapitalandInvestment 5 Pos. Net Investment Gross Investment 4 3 2 1 Deprec- iation Initial Capital Initial Capital [Ig(3)>D(2)] 5 Initial capital less deprec. Initial capital less deprec. 0 1/1/07 During 2007 12/31/07 Cal’s CD’s has a capital stock[5 machines] at the end of 2004 that equals its capital stock at the beginning of the year[4] + its net investment[+1]. Net investment is equal to Ig[3]-D[2]. Cal’s Ig is the 3 new machines bought during the year, and its depreciation is the 2 machines that Cal scrapped during the year. Capital – plant, equipment, buildings, & inventories of raw materials & semi-finished goods that are used to produce other goods/services. Investment-increases the capital stock (purchases of capital). Depreciation-decreases the capital stock(worn out/obsolete). Net Investment-change in a nation’s capital stock in one year. Investment[Ig(3)>depreciation(2)];Disinvestment[Depreciation(2)>Ig(1)].
CapitalandDisinvestment[D(2)>Ig(1)] 4 3 2 1 Neg. Net Investment Deprec- iation Initial Capital Initial Capital Gross Investment [D(2)>Ig(1)] Initial capital less deprec. Initial capital less deprec. 3 0 1/1/07 During 2007 12/31/07 Cal’s CD’s has a capital stock[5 machines] at the end of 2004 that equals its capital stock at the beginning of the year[4] + its net investment[+1]. Net investment is equal to Ig[3]-D[2]. Cal’s Ig is the3 new machines bought during the year, and its depreciationis the2 machines that Cal scrappedduring the year. Capital – plant, equipment, buildings, & inventories of raw materials & semi-finished goods that are used to produce other goods/services. Investment-increases the capital stock (purchases of capital). Depreciation-decreases the capital stock(worn out/obsolete). Net Investment-change in a nation’s capital stock in one year. Investment[Ig(3)>depreciation(2)];Disinvestment[Depreciation(2)>Ig(1)].
GDP 2006 [$13,487 Trillion] [2006] Consumption 9,429,300 [70%] Government purchases $2,570 [19%] Investment $2,186 [16%] Export Spending $1.210 -5% Import Spending $2.238
Average % Increases in Real GDP, 1890-2007 The key is to keep the economy growing. At 2.5% growth, the U.S. economy will expand to $23 trillionin 25 years. But – at 3%, it would reach $26 trillion, which is like another Germany, with Saudi Arabia thrown in. 5% 4.5% 3.5 3.8% 4% 3.3% 3.2% Long Term Growth 3% 2.7% 2.8% 2.6% 2% 0.8% 1% 0 1990 To 2000 1929 To 1940 1950 To 1960 1940 To 1950 1960 To 1970 1970 To 1980 1980 To 1990 1929 To 2000 1900 To 2007
GLOBAL PERSPECTIVE Comparative GDPs in Trillions, 2007 0 1 2 3 4 5 6 7 8 9 10 11 12 13 14 U.S. Japan Germany China U.K. France Italy Canada Spain Brazil S. Korea India Mexico Russia Australia 13.8 4.5 2.8 2.7 2.2 2.2 1.7 1.1 1.1 795 790 780 770 763 708
If California and Texas were countries where would they rank?
GLOBAL PERSPECTIVE Comparative GDPs in Trillions, 2006 0 1 2 3 4 5 6 7 8 9 10 11 12 13 14 U.S. Japan Germany China U.K. France Italy Canada Spain Brazil S. Korea India Mexico Russia Australia 13.8 4.5 2.8 2.7 2.2 2.2 1.7 Calif. 1.7 1.1 TX 1.1 1.1 795 .790 780 770 763 708
[Selected Countries] Per Capita GDP - 2007 Country Per Capita Sweden 36,900 U.K. 35,300 Germany 34,400 France 33,800 Japan 33,800 Italy 31,000 Australia 24,000 Russia 14,600 Mexico 12,500 China 5,300 Swaziland 4,800 Liberia 500 Zimbabwe 500 Congo, Rep of 300 Country Per Capita Luxembourg 80,800 Qatar 75,900 Bermuda 60,000 Norway 55,600 Kuwait 55,300 U.A.E. 55,200 U.S. $46,000 Ireland 45,600 Hong Kong 42,000 Switzerland 39,800 Iceland 39,400 Canada 38,200 Australia 37,500 Denmark 37,400 China and India are still poorer than he U.S. was in 1900. 75% of Africans live on less than $2 a day & it is getting worse.
GDP Over The Decades 13 tril. 13.8 tril. Per Capita $46,000 12 tril. 10 tril. 9 tril. 8 tril. 7 tril. 6 tril. 5 tril. 4 tril. 3 tril. 2 tril. 1 tril. 0 [If GDP increases, per capita income increases] 4,152 3,187 2,416 1,665 1,204 773 709 1929 1940 1950 1960 1970 1980 1990 2007
$46,000 2007 The World's Have-nots There are 6.6 billion peopleon our planet; 5 billion are in the Third World. 2.5 billion live on less than $2 a day. The direst poverty is in Africa, home of the world’s 10poorest countries. Over ½ the people of Sub-Sahara Africa live on less than$2 a day. 8 million people die each year because they are too poor to stay alive. ½ of the world’s population have yet to make their first phone call. $25,989 1996 • The PoorestNations • Nation Per Capita • Congo, Rep. of $300 • Zimbabwe $500 • Liberia $500 • Somalia $600 • Ethiopia $700 • Niger $700 • Cen. African Rep. $700 • Gambia, The $800 • Sierra Leone $800 • Malawi $800 • Djibouti $1,000 GDP Per Capita [in 1992 dollars] $15,931 1967 $6,538 1929
GDP – measures legal production in U.S. in one year. What 8 Things Do Not Count In GDP GDP measures allfinal goods/services produced by workers and capital located in the U.S., regardless of ownership. [Domestically located resources] Final goods are goods ready for consumption.
What Eight Things Do Not Count In GDP? 1. Intermediate Goods – components of the final good. A. Ford buys batteries or tires for its cars. B. KFC buys chickens to eventually sell to customers.
Value Added – increase in the market value at each stage Only Final Sales($20)Count[to prevent “multiple counting”($38)] $20 “Wife-beater” Shirt from Kohls Final Good Retail Shirt $20 $8 Intermediate Good 8 Wholesale Shirt $12 $7 $7 Value Added ($) Value of Output($) 7 Cloth $5 $4 $4 $4 4 Cotton $1 $1 $1 1 $1 $1 0 Shirt Manufacturer Cotton Farmer Textile Mill Retail Store $20 = sum Sum = $38 So, to avoid“multiple counting”, we count the$20final price, not$38.
GDP - what is not counted [#2] 2. 2nd Hand Sales – no current production. A. 1957 Chevy bought in 2007 Salesman 57 Chevy [It has not been produced again in 1963 & would not count.] The salesman is doing productive work. His commission would count. B. Boots produced in 1980 are bought in a Thrift Store in 07. They also have not been produced again. Salesman’s commission would count. You are buying his services. Shoe salesman
GDP - what is not counted [#3] 3. Purely Financial Transactions – stocks, bonds, CDs. There is no current production. Ex: If 100 shares of Dell stock is bought Buying stock is not buying a product but buying ownership of the firm. I’m not buying a Dell computer but part ownership of Dell. Exchanging one financial asset for another
GDP – what is not counted [#4]. 4. Transfer Payments –welfare, unemployment, social security. [There is nocontribution to final production] “Now that I’ve gotten my welfare check, I can get an iPhone”
5. Unreported “Legal” Business Activity Unreported “legal” business activity does not count. This is two-thirds of the “underground economy.” Before LASIK Surgery And what if the dentist doesn’t report $400 for teeth whitening? Then he has LASIK but the surgeon doesn’t report $500 of his $3,400 bill? And what if this waitress doesn’t report all tips?
6. Illegal business activity is also not counted. Illegal business activity, becauseit goes unreported, also does not count. Making up 1/3of the“underground economy,” it includes murder for hire, gambling, drugs, and prostitution. “I’m getting $1,000 to kill you, Ziggy, but at least it will not count in GDP.” And, what about “Jane Ho”?
U.S. Underground Economy Illegal $300 B Legal $600 B Drugs $120 Self Employed$255 Bribery $35 Gambling and Loan Sharking $10 Other Legal $25 Rents & Royalties $30 Pornography $20 Fraud $30 Corporate Profits $50 Other Illegal $20 Prostitution $30 Interest $55 Stolen Goods $35 Wages and Salaries $185 What gets reported is the “Above Ground” What doesn’t get reported is the “Underground”
U.S. Underground Economy Underground Economy[compared to “above ground”] Unreported exchanges that take place - legal and Illegal [Hidden – “off the books”] Total illegal activities - $300 billion Totallegalactivities - $600 billion Totallegal and illegal -$900 billion Underground Economy 1. Illegal business activities (1/3) – gambling, narcotics trade, prostitution, loan sharking, etc. 2. Unreported legal business activities (2/3) a. waitresses not reporting all of her tips b. Cabdriver not reporting all of his income c. Self employed cheat the most. Off-the-books cash transactions d. $300 billion *IRS estimates that about $300 billion in income taxes from the underground economy escapes federal taxes each year. $300 B
Underground Economy [as a Percentage of GDP for Select Nations] Percentage of GDP 0 5 10 15 20 25 30 Greece Italy Spain Portugal Belgium Sweden Germany France Holland United Kingdom Japan United States Switzerland Source: Journal of Economic Literature
7. Non-market Transactions Are Not Counted Work in your own household or volunteer workin the community does not count because there was no payment. You need to do some of this housework.
7. Non-market Transactions Are Not Counted Work in your own household or volunteer workin the community does not count because there was no payment. So, don’t marry your maid, gardener, or fitness instructor, or you will hurt GDP.
8. U.S. Corporations Producing Goods Overseas Nike in Indonesia GM in France IfU. S. corporationsproduce goods overseas, it does not count in GDP, but would count in GNP. Remember, we are measuring production inside the U.S. Imports represent production outside of the U.S.
Eight Things Not Counted in GDP [no production] • Second Hand Sales[no production] • Public/Private Transfer Payments • Purely Financial Transactions • Intermediate Goods 5. U.S. Corporations producing overseas 6. Non-market transactions [household or volunteer work] Underground Economy 7. Illegal business activity 8. Unreported legal business activity
Do These Count in GDP? -When Outback buys potatoes for baked potatoes • When a tattoo business buys ink for tattoos • When Tom Thumb buys spam to sell it to you • When the popsicle maker buys the sticks • Dell buys a computer monitor frame • Ice cream that Braums buys for sundaes • A bakery buys an apple to put in its pies • When Ford buys a windshield wiperfor a car • When hooker, J-Lo Ho, is paid $200.00
Is It Counted In GDP? On the next slide, read each sentence and determine, “To Be or Not To Be Counted?” That is the question. If “Yes”, put “Y” and tell if it is “C”, “Ig”, “G”, or “X”. If “No”, put “N” and give the number from below on why it is not counted in GDP. GDP DOES NOT INCLUDE 1. Second hand sales [no current production] [but the salesman’s commission counts] 2. Public/Private transfer payments [no current production] 3. Purely financial transactions [no current production] [broker’s fees do count] 4. Intermediate goods [component of final good] 5. U.S. corporations producing overseas. 6. Non-market transactions [ household or volunteer work. Underground Economy [not reported] 7. Illegal business activity [prostitution, murder-for-hire, illegal drugs, etc.] 8. Unreported legal business activity [“off the books”] Example: C Y ___ ___ 1. New Toyota Tundra truck manufactured in San Antonio and sold to your economics teacherthe year it was produced. ___ ___ 2. You buy a new Wii at GameStop in 2007. Does it count if you resell it on eBay in March of 2008? 1 N
Is It Counted In GDP? ___ ___ 1. You buy a purple “TinkyWinky” from Wal-Mart. ___ ___ 2. You and your family paint your house. [labor involved] ___ ___ 3. You marry your housemaid. [“working-for-love”] [her services] ___ ___ 4. You buy 100 shares of Microsoft Corporation. ___ ___ 5. You volunteer to babysit your little sister to help your parents while they work. ___ ___ 6. Bob buys a 1965 ford Mustang convertible which is in mint condition. ___ ___ 7. The salesman gets a commission [pay] for selling that 1965 Ford Mustang in 2008. ___ ___ 8. You and your friend volunteer to cook at the senior class picnic. ___ ___ 9. Dr. Payne does $1,000 worth of dental work but reports only $500 of it. Does the $500 the dentist keeps and doesn’t report count? ___ ___ 10. You are given s suitcase full of $100 bills from the sale of smuggled drugs. ___ ___ 11. Your mother is teaching you to read [and not having much success]. ___ ___ 12. Your dad bakes you a home-baked loaf of bread. [his labor] ___ ___ 13. You buy a loaf of bread from Kroger’s Grocery Store. ___ ___ 14. The U.S. government purchases 5 more B-2 Bombers for $2 billion each. ___ __ 15. Ford buys a ton of sheet metal used in making car doors. ___ ___ 16. You buy a new “iPod Video” from the Apple store, ___ ___ 17. You send in a $90 check to your dentist for cleaning your teeth. ___ ___ 18. Your family buys a new house which sits next to the mansion of Bill Gates. ___ ___ 19. 100 additional teachers are hired by the Frisco ISD. ___ ___ 20. GM invest in $500 million worth of robots to assemble their cars. ___ ___ 21. You volunteer 10 hours a week of your time to work for senior citizens. ___ ___ 22. Ford produces 25,000 new F150s which are not sold by the end of the year. ___ ___ 23. Russia buys 3,000 Dell computers as they become Rusky Dell Dudes. ___ ___ 24. A man’s wife does all his cooking and sewing, working for him 16 hours per day. ___ ___ 25. Nike produces $10 million worth of Nike Air Jordan’s in Vietnam. C Y 6 N N 6 3 N 6 N 1 N C Y 6 N 8 N 7 N N 6 N 6 C Y G Y 4 N Y C C Y Ig Y G Y Ig Y 6 N Ig Y X Y 6 N 5 N
Know How To Figure NIA. [This will be worth 10 points on your next test]
16th Ed. National Incoming Accounting – 2002 [$10,446] $7,304 [“C”] Consumption [66%] -Depreciation $1,393 “UCanSee Thunderducks” +N.F.F.I. $10 -$141 Undis Cor Pro -$213 Corp Inc Tax -$748 Soc Sec Con Y earned/not received $9,053 [Replacement capital] [births-deaths] “Available for sale” -Indirectbus. Tax $695 +$1,683 Trans Pay Y received/not earned $8,929 PI is what we can spend, save, or pay in taxes. “Income received by households, whether earned or unearned” • Personnel • Taxes • -$1,113 $8,018 [“indirect” tax] (Tax on the G/S, not on profits) [sales, property, excise, tariffs, & license fees] “Income earned by U.S. resources” ROW[$220] U.S. [$230] NFFI = -$10 Gross Private Domestic Investment $1,593 $7,816 DI is what we can SPEND or SAVE. For NI Subtract NI N=NFFI I= Indirect business taxes Government Purchases $1,973 Xn(X-M) -$424 NDP PI GDP NI DI
Depreciation, Investment&Disinvestment Positive Net Investment IgexceedsDepreciation Negative Net Investment DepreciationexceedsIg Ig $2,105 Trillion Investment of$531 bil. Depreciation 1933 $7.6 billion [in current dollars] Disinvestment of $6 billion Great Depression [1933] Expanding productive capacity Declining productive capacity Depreciation 2005 $1,574 Trillion Ig $1.6 billion Ig($1.6)-D($7.6)=(Disinv. of $6) (Disinvest. of $6)+D($7.6)=($1.6) Ig($1.6)–Disinv.($6)=(Depr. of $7.6) Ig($2,105)-D($1,574)=(In of $531) In($531)+D($1,574)= (Ig of $2,105) Ig($2,105)-In($531)=(Depr. of$1,574)
THE MIX OF OUTPUT IN 1900 THE MIX OF OUTPUT IN 2000 Construction and Mining 6% Construction and Mining 9% Government 18% Manufacturing 22% Farming 2% Services 22% Farming 37% Manufacturing 20% Services 54% Government 10% A Century of GDP Changes