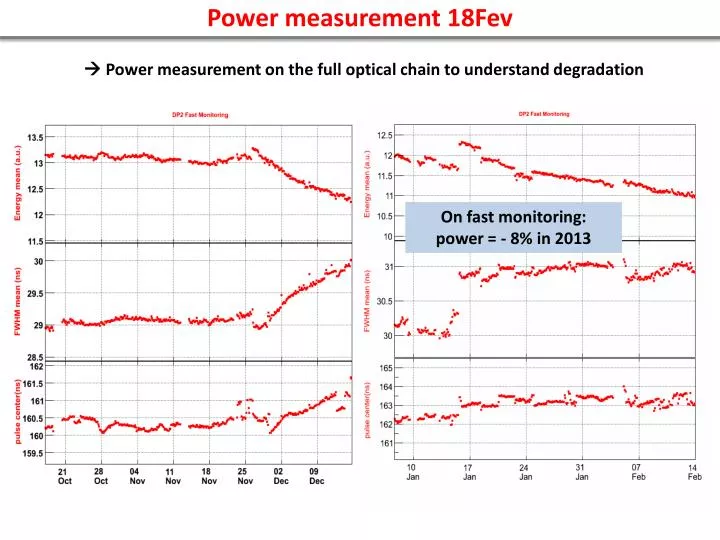
Power measurement 18Fev
40 likes | 148 Vues
This report presents measurements and analysis of optical power in the full optical chain as conducted on February 18 and September 20. Observations show a power drop of approximately 8% in 2013. Notably, the DP2 optical path was analyzed with power outputs of 40 mW at 45 A and 73 mW at 55 A. Loss measurements were taken to quantify insertion loss (IL) across different channels. Results indicate that optimization of the XYZ mounting and cleaning of connectors recovered 1 dB of loss since September, showcasing the importance of regular maintenance and monitoring for performance stability.

Power measurement 18Fev
E N D
Presentation Transcript
Power measurement 18Fev Power measurement on the full optical chain to understand degradation On fast monitoring: power = - 8% in 2013
Power measurement 18Fev 20 Sept:(new DP2 optical path) DP2 P0 = 40 mW@45 A (73mW@55A) 1x 100 Coupling+ att. Att. box 1X5 DP2 IL (ch99) = 12db 2.5 mW Ch.99 27 April: IL(ch1) = 12.5 dB for DP2 (done at 55A) 18Fev: P0 = 40 mW@45 A (73mW@55A) Laser itself unchanged. First measurement: IL(ch99) = -12.7 dB ; IL(ch1) = -13.5 dB +-1 dB extra Second measurement : After cleaning 1x5 switch fibre (higher attenuation here) and tuning the XYZ mount of the main fibre: IL(ch1) = -12.6 dB Same as April 2012.
Power measurement 18Fev Detail of the Measurement, 18 Fev: IL (dB) Main fibre 20m Test fibre 40 mW Coupling+ att. 4.2 dB (was 2.56 in Sept), too high DP2 15.5 mW 1 Test fibre 6.4dB 1X5 Coupling+ att. DP2 2 9.3 mW 10dB Coupling+ att. Att. box 1X5 DP2 3.9 mW 3 1x 100 Coupling+ att. Att. box 1X5 DP2 IL(ch1) 13.5 dB 1.8mW 4 Ch.1 1m fibre Coupling+ att. DP2 27.4 mW 1.6 dB after optimize XYZ mount Before : 1.95 dB 5 Test fibre Coupling+ att. DP2 20.4 mW 2.9dB. Cleanning fibre 1x5 6 1x 100 Coupling+ att. Att. box 1X5 DP2 2.2mW 7 IL(ch1) 12.6dB
Power measurement 18Fev Results : Recover 1 dB extra lost since Sept. by optimizing the XYZ coupling + cleaning 1 connector. Waiting Matacq plots to see effect.