Tableau Public Tutorial
Learn the basics for creating visualizations with Tableau Public.No programming skills are required to do this. It is mostly useful for Journalists, writers, bloggers, students, professors, hobbyists, critics, citizens and more..<br>Learn Tableau Today<br>http://professional-guru.com/courses/tableau-online-training/


Tableau Public Tutorial
E N D
Presentation Transcript
TableauPublic tutorial PROFESSIONAL G UR U
Before youstart: Download Tableau Public from: http://www.tableausoftware.com/public/download-steps Create a Tableau Public account at: https://public.tableausoftware.com/auth/signup Download the dataset from: http://www.peteraldhous.com/Data/USDA_activity_dataset.xls PROFESSIONAL G UR U
TheData: OpenUSDA_activity_dataset.xlsandexaminethecontents. Thedatadetailsphysicalactivity,obesity,andotherhealthdatain nearly100columns,formorethan3000rows,oneforeachcountyin theUS. Connect to thedata DraganddropUSDA_activity_dataset.xlsontopoftheTableauPublicicon onyourdesktoptoopen. Atthedialogbox,clickOKtoconnect. Tableauautomaticallyrecognizescategoricalfields,like“State,”and numericalmeasureslike“Adultobesityrate.” PROFESSIONAL G UR U
Createthefirstview(amapforeachstate showingobesityratesatthecountylevel): Doubleclickon“State”and“County.”TableauPublicrecognizestheyare geographicalfieldsandgeocodesthemaccordingly. Youmaygetawarningmessage;ifso,checksothatyoudon’tseeitagain. Noticethereisapointat0degreeslatitudeandlongitude.Thesearenull values. Selectthembyclickingtoonesideofthepoint,keepthemousebutton depressedtodrawarectangleoverit,thenrelease. RightclickontheselectednullvaluesandselectExclude. RightclickontheExclusionsinFilterandselectMakeGlobal,so thatthiswillapplytoallsubsequentviews. Nowyouhaveamapshowingadotforeverycounty whereyouhavearecord: PROFESSIONAL G UR U
Drag“Adultobesityrate”fromtheMeasurespanelintoColor,andcopyit intoSizeshelftoencodecountiesbythosevalues. ChangetheColortoRed–White-GreenDiverging,andreverseit: PROFESSIONAL G UR U
Nowaddafiltertoenabletheselectionofindividualstates.Click anddrag“State”intotheFiltersshelf,clickOKatthedialogbox. Rightclickon“State”intheFiltersshelfandselectShowQuick Filter.DeselectAllandthenselectAlabama. Renametheworksheet“MapView”byrightclickingonthetabat thebottom. Finishedstateoffirstview: PROFESSIONAL G UR U
Addasecondview(scatterplotsshowingtherelationshipbetween obesityandhealth-relatedbehaviorsatthecountylevel): PROFESSIONAL G UR U
Add newworksheet: Drag“Adultobesityrate”ontoRowsand“%smokers,”“%eatingfew fruitsandvegetables”and“%whodonotexercise”intoColumns. Drag “County” and “State” into Level of Detail. Without this step, Tableau’s default behavior is to sum the values across all the counties andstates,whichwillgiveyouasingledatapointforeachgraph,andnot thedesiredscatterplots. PROFESSIONAL G UR U
Theviewlooklikethis ChangeColortopurple,opentheDropdownmenunextto“Automatic” and select circle, then move the slider below to the left to increase transparencyofthepoints. SelectAnalysisinthetopmenuandcheckTrendLines. Renametheworksheet“ScatterplotView”byrightclickingonthetabat thebottom. PROFESSIONAL G UR U
Finishedstateofsecondview: CreateaDashboardwithbothviews: Adddashboard: PROFESSIONAL G UR U
Double click on each view to bring both out onto the dashboard.RightclickontheStatefilter,selectCompact list. Rightclickonthisfilteragain,andselectMakeGlobal. Thiswillensurethatselectingastatealtersbothviews simultaneously. Rightclickonthisfilterforathirdtime,selectCustomize anduncheckShow“All”Value. Thispreventsusersfromseeingtheentiredataforallthe US. RightclickonthetitlesofeachviewandselectHideTitle. Renamethedashboard“Obesitybystateandcounty”by rightclickingonthetabatthebottom. DoubleclickonTitleunderObjects PROFESSIONAL G UR U
Save to theweb: UnderSize,clickEditandselectthesizeandlayoutbestforyourwebsite. ClickFileonthetopmenuandselectSavetoWeb.Youwill beaskedforyouraccountloginatthispoint.c PROFESSIONAL G UR U
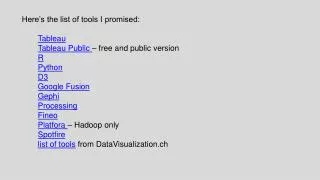
Embedonyourwebsite/blog: IntheSaveToWebResultswindowthathasopenedup,scrolldown beneaththevisualizationandclickonShare. Copyandpastetheembedcodeintothehtmlofyourwebpage. You should now have this online visualization: http://www.peteraldhous.com/tableau_demo.html You can also download a PDF of this handout from: http://www.peteraldhous.com/CAR/tableau_demo.pdf PROFESSIONAL G UR U