GIS for Health Program Overview
340 likes | 802 Vues
Explore GIS basics, functions, and applications in public health, decision support systems, and spatial analysis. Learn about GIS data integration, spatial reference, and practical uses in disease mapping and resource allocation.

GIS for Health Program Overview
E N D
Presentation Transcript
GIS for Health Program By Tris Eryando
Understand what a GIS is • Understand how a GIS functions • Understand how spatial data is • represented in a GIS • Look at some GIS applications
Data vs Information • Data, by itself, generally differs from • information. • Data is of little use unless it is transformed • into information. • Information is an answer to a question • based on raw data. • We transform data into information • through the use of an Information System.
What is an Information System? SYSTEM USED FOR: capturing storing updating manipulating analyzing DATA
What is a GIS? Information System • A means of storing, • retrieving, sorting, • and comparing • spatial data • to support some • analytic process. + Geographic Position
GIS • Geographic Information Science • Geographic Information Studies • Geographic Information Systems Science = basic research Studies = education related undertakings Systems = applied situations
Intel Database GIS Functions Data Assembly Manual Digitizing Scanning Manual Digitizing Scanning RSI Maps Data Transfer Data Transfer Direct Entry GPS Keyboard
Defineproblem Decision GIS Process Define GIScriteria Output Import orbuild datasets GISanalysis Geographic Information Systems Defineproblem Decision GIS Process Define GIScriteria Output Import orbuild datasets GISanalysis
GIS as a Databese A database system where most of the data is spatially indexed and a set of procedures that serve to answer questions about spatial entities in the database dynamic linkage
GIS as decision support system • GIS is a decision support system that involves the integration of spatial-referenced data in a problem-solving environment
What can you do with a GIS? • The possibilities are unlimited… • Environmental impact assessment • Resource management • Land use planning • Tax Mapping • Water and Sanitation Mapping • Transportation routing • and more ...
How does a GIS work? • GIS data has a spatial/geographic reference • This might be a reference that describes a feature on the earth using: • a latitude & longitude • a national coordinate system • an address • a district • a wetland identifier • a road name
Very high 3 Scrub 17 Clay Polygon Geography and Databases • A GIS stores information about the world as a collection of thematic layers that can be linked together by geography
107’ Vectors Dimensions Topology Surveys ABC Networks Images Annotation CAD Drawings 27 Main St. 3D Objects Attributes Addresses Terrain GIS provides Data Integration • Roads • Land Parcels • Population • Utilities • Land Mines • Hospitals • Refugee Camps • Wells • Sanitation
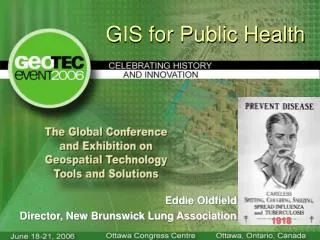
Uses of GIS in Public Health • Determining geographic distribution of diseases • Analyzing spatial and temporal trends • Mapping populations at risk • Stratifying risk factors • Assessing resource allocation • Planning and targeting interventions • Monitoring diseases and interventions over time Source: World Health Organization (WHO)
G I S • GIS is a computer system for capturing, storing, querying and analyzing and displaying gåeographic data • GIS is a computer-based systems for the integration and analysis of geographic datas
In the Health Sector, GIS Can Answer the Following Questions and Serve the Following Functions: • Condition : What is ... • Location : Where is ... • Trends : What has changed since .... • Patterns : What spatial patterns exist... • Modeling : What if ....
GIS functions (Goodchild,1995) • The ability to store or compute and display spatial relationships between objects • The ability to store many attributes of objects • The ability to analyze spatial and attribute data in addition to simply managing and retrieving data • The ability to integrate spatial data from different sources
Medical/health geography Medical geography “Geographical analysis of health, disease, mortality and health care” Geography of health “the subdiscipline focused on the dynamic, and recursive, relationship between health, health services, and place, and on the impact of both health services and the health of population groups on the vitality of places” (The Dictionary of Human Geography (2000)
Spatial analysis in GIS • Measurement • Topological analysis • Network analysis • Surface analysis • Statistical analysis • Nearest neighbor • Spatial autocorrelation • Spatial interpolation
METHOD of NNA • Method used to explain the spreading pattern of 27 public health centers in Depok city is nearest-neighbor analysis to identify if that spreading is clustered, random, or uniform.Nearest-neighbor analysis is a quantitative method using mathematical calculation with the formula as follow (Hagget, 2001): • Rn=spreading index of the nearest neighbor • Dobs=average distance measured between one spot with another spot of its nearest neighbor (in kilometers) • Dexp=average distance obtained if all dots have random pattern (in kilometers) • a = the spot density in kilometers square • R= 1,00 random pattern, R > 1,00 uniform pattern, R < 1,00 clustered pattern
The analysis on the spreading pattern of health service facilities using nearest-neighbor analysis model results in R value or index of the nearest-neighbor spreading at 1,399. This means that R value > 1,00 so the pattern of Puskesmas spreading in Depok city is random • RESULTS • Distribution of Puskesmas, The number of Puskesmas in Depok city is 27 which cover 2 until 3 districts. • the width of settlement (built) in Depok city is 90,24 km2 or 45,05 % of Depok city width. Based on the map of Puskesmas spreading in Depok city settlement, it can be seen that yellow color (the settlement) is widespread almost in all Depok city area
Classification • Network (jaringan) • Overlay • Buffering. • Function GIS for spatial analysis • Relocation and Expansion - Item, time and space Diffusion theory Expansion diffusion Relocation diffusion
Expansion Diffusion Expansion Diffusion of filariasis in Bekasi (West Jawa),the cases begins from 2001 (4 cases), 2002 (8 cases) and 2003 (32 cases) 2003 2002 2001
Buffer Analysis, to count access from public health service (puskesmas)
RESULTS • By using SIG model, that is, by determining buffer from Puskesmas dots and buffer from the road. • In terms of Puskesmas buffer, the distances used are 0-200 meters, 201-500m, 501-1000m, >1000 meters from Puskesmas dots. • In terms of road buffer, the distances used are 0-200 meters from main roads, 201-500 m, 501-1000 m and >1000 meters from main roads. it can be seen that there are two colors to identify the scope areas of Puskesmas to settlement in Depok city. The dark blue color indicates areas which have distances with more than or equal to 3000 meters from Puskesmas, whereas the light blue color indicates areas which have distances with less than or equal to 1000 meters from Puskesmas