Download
1 / 4
40 likes | 57 Vues
This science starter activity involves drawing a motion graph of a tennis ball bouncing off a wall and back. The lab focuses on measuring the speed of an average teenager using timed activities. Participants will gather materials, perform activities, and create data charts and graphs. Afterward, students will be directed to complete a student survey.

E N D
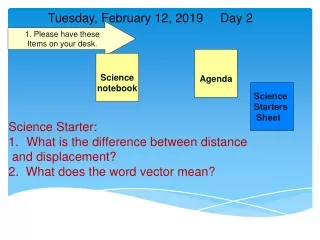
1. Please have these Items on your desk. ScienceStarters Sheet Science Notebook Agenda Tuesday, February 12, 2019 Speed lab STARTER- 1. Draw the motion graph of a tennis ball getting thrown onto a wall and then bouncing back to you.
Problem: How fast is the average teenager? • Hypothesis: If….then…because (refer to prior knowledge) • Materials: • 1 meter stick • 2 timers • 1 roll masking tape • 1 sharpie marker • Procedures: • Gather materials. • 3 participants (at least) • 10 meter (at least) • Participants have to do 4 activities down the track. (Example: walking, skipping, hopping…)
Complete speed lab • Create a data chart with correct labels and units. • Create a distance/time graph with correct labels and include units.
SSR-Student survey • Survey Link: http://bit.ly/19link • The password it your student number.