Image Analysis, Interpretation & Classification
Image Analysis, Interpretation & Classification. Dr. Garver GEO 420. United Launch Alliance (ULA) Atlas-V rocket with the Landsat Data Continuity Mission (LDCM) spacecraft launched Monday, Feb. 11, 2013 at Vandenberg Air Force Base .
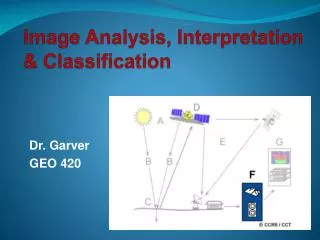

Image Analysis, Interpretation & Classification
E N D
Presentation Transcript
Image Analysis, Interpretation & Classification Dr. Garver GEO 420
United Launch Alliance (ULA) Atlas-V rocket with the Landsat Data Continuity Mission (LDCM) spacecraft launched Monday, Feb. 11, 2013 at Vandenberg Air Force Base. The LDCM mission is a collaboration between NASA and the U.S. Geological Survey that will continue the Landsat Program's 40-year data record of monitoring the Earth's landscapes from space.
The payload faring containing the Landsat Data Continuity Mission LDCM spacecraft is lifted to the top of Space Launch Complex-3E at Vandenberg Air Force Base where it will be hoisted atop a United Launch Alliance Atlas V for launch.
Orbiting Carbon Observatory (OCO) Failed following a rocket malfunction • fairing - part of rocket which covers satellite on top of launcher - did not separate properly. • crashed into ocean near Antarctica. • Nasa officials confirmed loss of the satellite at a press conference held at 1300 GMT.
Orbiting Carbon Observatory (OCO) – Feb. 2009 • Collect precise global measurements of carbon dioxide (CO2) • Improve understanding of natural processes and human activities that regulate abundance and distribution. • Enable more reliable forecasts of future changes in abundance and distribution of CO2 in atmosphere and the effect changes may have on Earth's climate.
Important Aspects of OCO Mission Study carbon dioxide sources (where it comes from) and sinks (where it is pulled out of the atmosphere and stored). OCO-2 high-resolution spectrometers spreads reflected sunlight into its various colors like a prism, focusing on different, narrow color ranges to detect light with the specific colors absorbed by carbon dioxide and molecular oxygen. The amount of light absorbed at these specific colors is proportional to the concentration of carbon dioxide in the atmosphere. Scientists will use these data in computer models to quantify global carbon dioxide sources and sinks.
Scientists don't know why the amount of carbon dioxide absorbed by Earth's natural ocean and land "sinks" varies dramatically from year to year. • These sinks help limit global warming. • The Orbiting Carbon Observatory will help scientists better understand what causes this variability and whether natural absorption will continue, stop or even reverse.
Landsat 5 set Guinness World Records title - Longest-operating Earth observation satellite • Outliving its three-year design life, Landsat 5 delivered high-quality, global data of Earth's land surface for 28 years and 10 months.NASA launched Landsat 5 from Vandenberg Air Force base in Lompoc, Calif. on March 1, 1984. Landsat 5 was designed and built at the same time as Landsat 4 and carried the same two instruments: the Multispectral Scanner System (MSS) and the Thematic Mapper (TM).
Midterm • Overview & History of Remote Sensing • 2_intro_history.ppt • Energy • Sources & Radiation Principles • Interactions in the Atmosphere and at the Surface • 3_energy.ppt • 4LK_pg1-12.ppt • 5_atmosphere.ppt • 6_spectralsigs.ppt • Data acquisition/Characteristics of R.S. Systems • 7_sensors.ppt • Landsat Program • 8_landsat.ppt
Materials from weeks 1 to 4 • Primary Text: Online fundamentals of Remote Sensing • Section 1 & 2 • L&K Handout (1 & 2) • Other Links: • Supplementary online text: Remote Sensing Tutorial. • Videos, Glossary • Exercise #1 and #2 • Quiz #1 and #2
How do we extract meaningful information from imagery? 6. Interpretation and Analysis (F) - the processed image is interpreted, visually and/or digitally, to extract information about the target which was illuminated.
7 elements of the remote sensing process. 1. Energy Source or Illumination (A) – the first requirement for remote sensing is to have an energy source which illuminates or provides electromagnetic energy to the target of interest. 2. Radiation and the Atmosphere (B) – as the energy travels from its source to the target, it will come in contact with and interact with the atmosphere it passes through. This interaction may take place a second time as the energy travels from the target to the sensor. 3. Interaction with the Target (C) - once the energy makes its way to the target through the atmosphere, it interacts with the target depending on the properties of both the target and the radiation.
4. Recording of Energy by the Sensor (D) - after the energy has been scattered by, or emitted from the target, we require a sensor (remote - not in contact with the target) to collect and record the electromagnetic radiation. 5. Transmission, Reception, and Processing (E)- the energy recorded by the sensor has to be transmitted, often in electronic form, to a receiving and processing station where the data are processed into an image (hardcopy and/or digital). 7. Application (G) - the final element of the remote sensing process. apply the information we have been able to extract from the imagery in order to better understand the target we are studying.
How do we extract meaningful information from imagery? 6. Interpretation and Analysis (F) - the processed image is interpreted, visually and/or digitally, to extract information about the target which was illuminated.
Interpretation and analysis r.s. of imagery - the identification and/or measurement of various targets in an image to extract useful information. • Much interpretation and identification of targets is performed manually or visually, by a human interpreter. • done using imagery displayed in a photograph-type format • independent of what type of sensor was used to collect data
Images are represented in a computer as arrays of pixels, with each pixel corresponding to a digital number, representing the brightness level of that pixel in the image. • digital format.
Both analog and digital imagery can be displayed as black and white (monochrome) images, or as color by combining three bands representing different wavelengths.
Analog and Digital Images • Image - two-dimensional representation of objects in a real scene. • representations of parts of the earth surface as seen from altitude. • Images may be analog or digital. • Aerial photographs - examples of analog images • Satellite images - acquired using electronic sensors are examples of digital images.
4.3 Digital Image Processing • R. S. data are recorded in digital format, so virtually all image interpretation and analysis involves some element of digital processing. • Need appropriate hardware and software to process data. • Several commercially available remote sensing image processing and analysis software systems exist.
Image processing software Erdas Imagine ENVI
4.3 Digital Image Processing • Common image processing image analysis functions: A. Preprocessing B. Image Enhancement C. Image Transformation D. Image Classification and Analysis
A. Preprocessing - operations normally required prior to main data analysis & extraction of information. • radiometric corrections • correcting data for sensor irregularities, sensor or atmospheric noise • converting data to accurately represent reflected/emitted radiation measured by sensor. • Typically done before we get data.
A. Preprocessing - operations normally required prior to main data analysis & extraction of information. • geometric corrections • correcting distortions due to sensor-Earth geometry variations • conversion of data to real world coordinates (e.g. latitude and longitude).
B. Image enhancement - improve the appearance of the imagery to assist in visual interpretation and analysis. • contrast stretching - increase the tonal distinction between various features in a scene. • spatial filtering - enhance (or suppress) specific spatial patterns in an image.
Contrast stretching • Raw imagery - data populates only a small portion of the available range of digital values (commonly 8 bits or 256 levels). • Change the original values so that more of the available range is used, thereby increasing the contrast between targets and their backgrounds.
Contrast stretching • Image histogram - a graphical representation of the brightness values that comprise an image. • brightness values (i.e. 0-255) displayed along x-axis of graph • frequency of occurrence of values shown on y-axis.
Spatial filtering • Highlight or suppress specific features in an image based on spatial frequency. • Spatial frequency - variations in tone that appear in an image. • High spatial frequency - “rough" textured areas of an image - changes in tone are abrupt over a small area. • Low spatial frequency - "smooth" areas with little variation in tone over several pixels.
C. Image transformations - processing of data from multiple spectral bands. • Arithmetic operations (i.e. subtraction, addition, multiplication, division) are performed to combine and transform the original bands into "new" images which better display or highlight certain features in the scene. • spectral or band ratioing • principal components analysis
Spectral ratioing - one of the most common transforms applied to an image. • Ratioing data from different spectral bands. • resultant image enhances variations in the slopes of the spectral reflectance curves between the two different spectral ranges that may otherwise be masked by the pixel brightness variations in each of the bands.
Vegetation Indices Normalized Difference Vegetation Index (NDVI) Used to map global primary production and is computed
D. Image classification - digitally identify & classify pixels. • usually performed on multi-band data sets (A) • assigns each pixel in an image to a particular class or theme (B) based pixel brightness values.
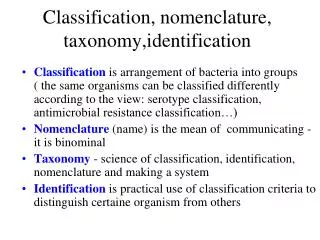
Interpretation & Classification • Classifying features into meaningful categories or classes. • Image then becomes a thematic map • Unsupervised classification - features separated solely on spectral properties • Supervised classification - some prior or acquired knowledge of classes
Spectral Signatures of 4 Materials Band 1 = 0.55 um Band 2 = 0.85 um
GL = grasslandsPW = pinewoods RS = red sandSW = silty water
Unsupervised Classification A thematicmapis designed to show a particular theme connected with a specific Geographic area
Supervised Classification • Ground truth • Select training sites • after unsupervised classification • prior to supervised classification
Field Instruments • Detailed spectral signatures using; • spectrometers, spectrophotometers, and radiometers • laboratory, field, aircraft • Define reference signatures
Training Sites • Determine Land Cover/Use categories to classify (map) a scene, using space observations, assisted by other information sources. • Select sites in sufficient number, size and shape, variety, and distribution to maximize accuracy of classification.